Investing in a fully automatic high-speed PET bottle production line is one of the most consequential capital decisions a beverage, edible-oil, detergent or bottled-water producer can make, yet the debate is too often framed around a single acquisition figure. A more useful frame is the cost recovery cycle: the operational span over which the line’s recurring physical savings—resin, electricity, compressed air and labor—accumulate to offset the burden of ownership. YuDa, a Wanplas factory with more than twenty years dedicated to PET bottle blow molding, designs rotary stretch blow molding machines, blow fill cap combi blocks and semi-automatic units for more than sixty countries. This article explains how the recovery cycle is engineered, measured and shortened using index-based and physical-unit methods that require no currency exposure. By the end, a plant manager can read a line’s cavity count, rated output, utilization and OEE and place it into a defensible payback band expressed only in months and relative grades.
1. What Defines a Fully Automatic High-Speed PET Bottle Production Line
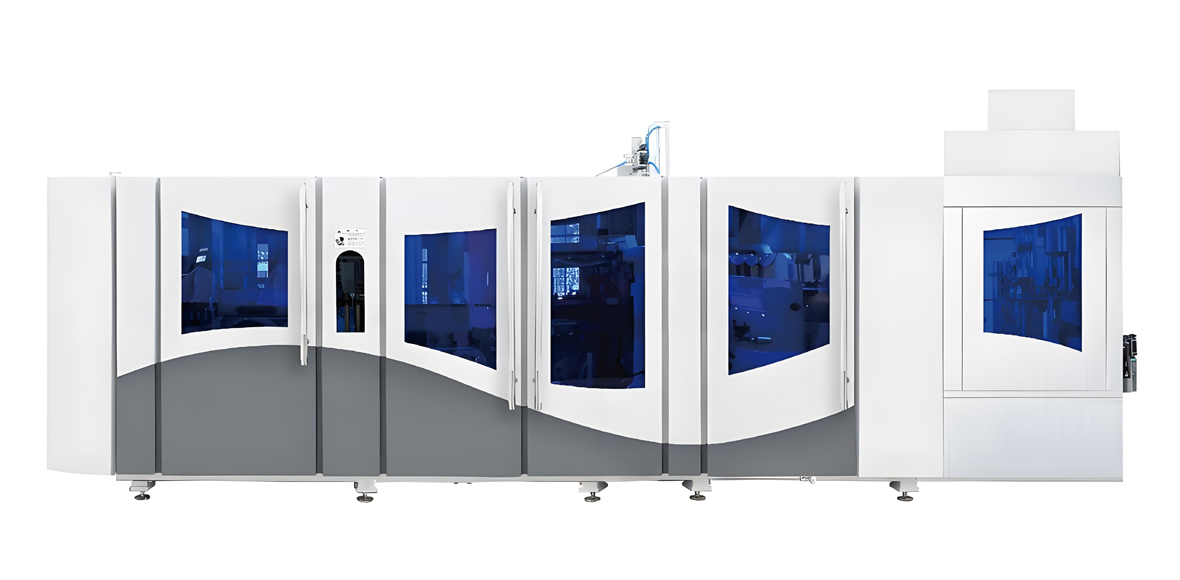
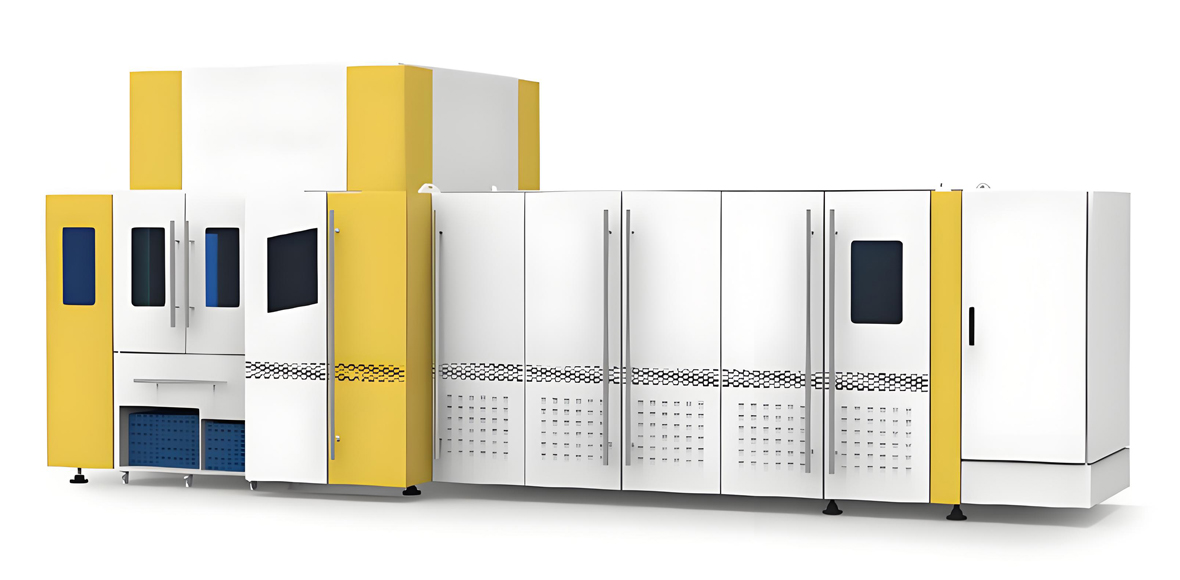
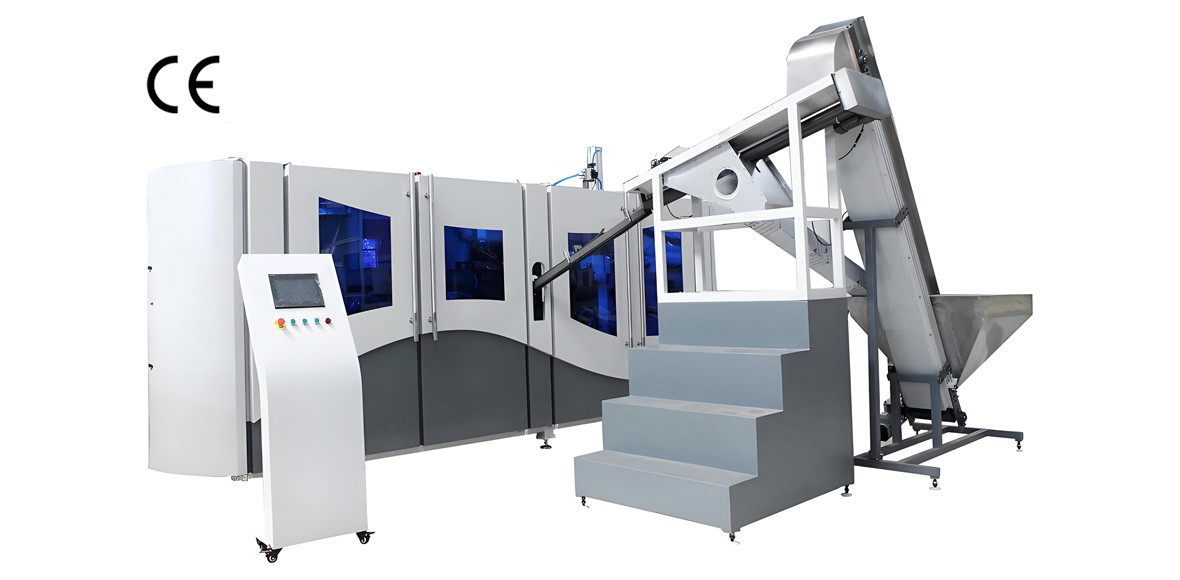
A fully automatic high-speed PET bottle production line is built around a rotary stretch blow molding machine in which preforms are heated in an oven, transferred to a rotating blow wheel, conditioned, stretched by a stretch rod and blown against a blow mold to form the bottle. The word “high-speed” is not vague: it refers to cavity count and the resulting rated bottles per hour at a reference bottle, conventionally a 500 mL water bottle. Rotary machines scale output by adding cavities and shortening the rotation pitch, so a six-cavity machine reaches roughly 12,000 bottles per hour while a twenty-four-cavity machine reaches about 72,000 bottles per hour. Between these extremes sit eight, twelve, sixteen and twenty cavity configurations covering 18,000, 24,000, 36,000 and 48,000 bottles per hour respectively.
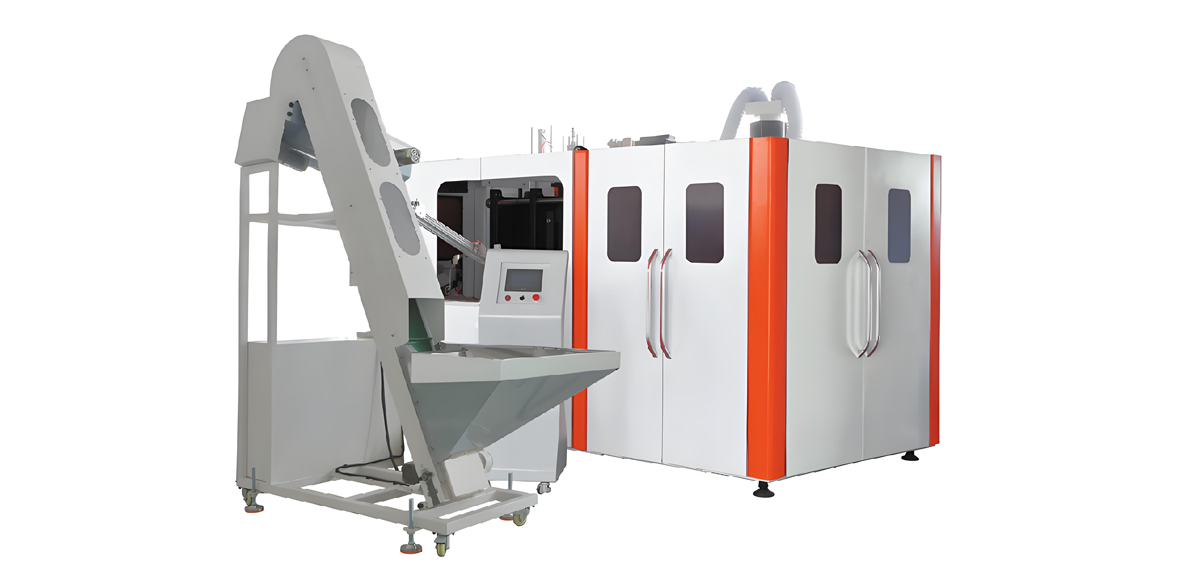
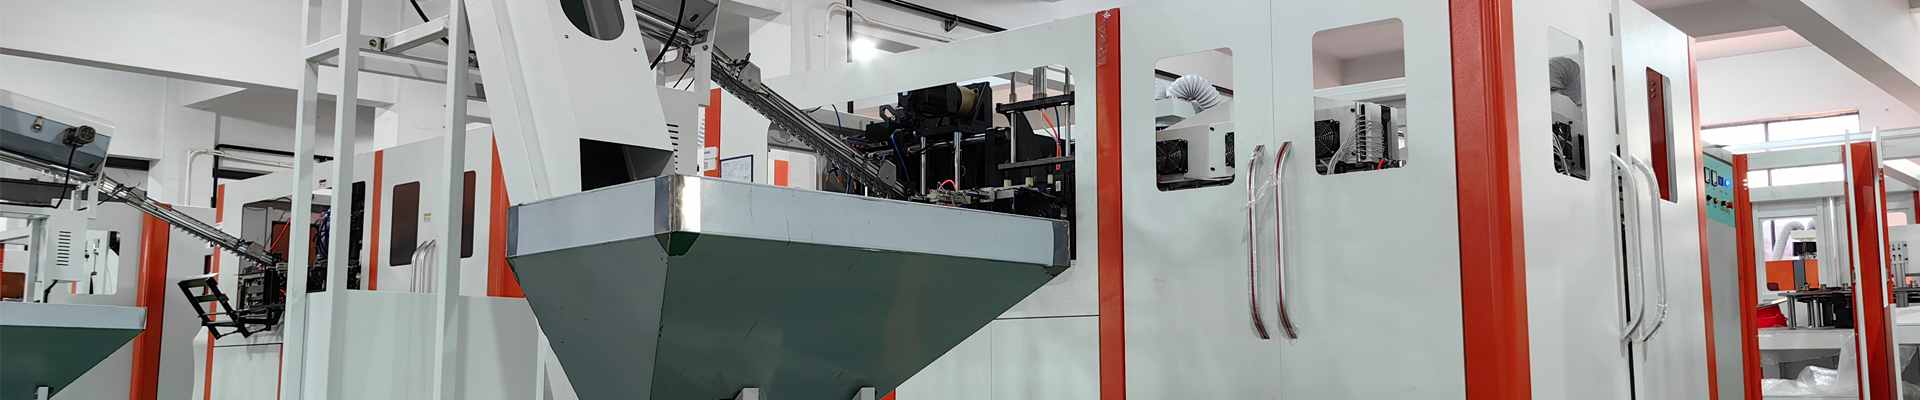
The “fully automatic” qualifier matters because it describes the surrounding chain, not only the blow molder. A complete line integrates an automatic preform loader and unscrambler, a closed-loop oven with infrared lamps, the rotary blow molder, an air conveyor that carries finished bottles to a filler, a capper, a rinser or washer, a labeler, a date coder, a shrink-wrapper or cartoner, a case packer and a palletizer. Operators are present for supervision, quality checks and changeovers rather than for manual bottle handling. YuDa’s FGX series high-speed machines apply a cam-linking system that merges mold opening, mold locking and base-mold elevation into one motion, driven by a high-speed servo system, which is the mechanical basis for holding short cycle times at high cavity counts.
A critical distinction is between a blow fill cap combi block and a split line. In a combi block the blow molder, filler and capper are mounted as a single monoblock so that freshly blown bottles travel a few centimeters of clean air conveyor directly into the filler without ever touching the ambient plant floor or a long accumulation buffer. A split line separates blowing from filling with a buffer and a longer air conveyor. The combi block saves plant area, reduces bottle handling losses and trims the energy and labor components of the unit-bottle consumption index, while the split line offers flexibility to share one blow molder with multiple fillers or to run several bottle formats through a common filler. Both are “fully automatic,” but they sit at different points on the recovery cycle because their consumption profiles differ.
The table below maps cavity count to rated output and to the bottle types each configuration typically serves. These are reference values at 500 mL water; actual output varies with bottle weight, neck finish, base design and the cooling duty of the specific preform.
Cavity Count, Rated Output and Bottle Type Reference
| Cavity count | Rated output, 500 mL water (bph) | Typical bottle types and volume range | Configuration note |
|---|---|---|---|
| 6 | 12,000 | 330 mL to 750 mL water, still drinks | Rotary blow molder, entry high-speed |
| 8 | 18,000 | 330 mL to 1,000 mL water and carbonated | Rotary, single servo stretch |
| 12 | 24,000 | 500 mL to 1.5 L water and CSD | Rotary, dual servo, common mid-tier |
| 16 | 36,000 | 500 mL to 2 L water and CSD | Rotary, dual servo, heavier base |
| 20 | 48,000 | 500 mL to 1.5 L water | Rotary high-speed, servo everywhere |
| 24 | 72,000 | 500 mL to 1.0 L water | Rotary top tier, ultra-light preform |
2. The Engineering Levers Behind the Cost Recovery Cycle
The recovery cycle is not a mystery of accounting; it is an accumulation of physical savings. A line that consumes less resin per bottle, fewer watt-hours per bottle, fewer normal liters of compressed air per bottle and fewer seconds of labor per thousand bottles will recover faster than a line that consumes more, provided both run at comparable utilization. The levers are additive, which is why an index method works better than a single ratio. The five primary levers addressed in this article are lightweighting, labor substitution, electricity optimization, yield improvement and high-pressure air recovery. Each is expressed as an annual saving index contribution rather than as a currency figure, so the method stays valid across every market where resin and energy carry different local weights.
Lightweighting reduces the recurring resin draw by lowering preform gram weight, and because resin is metered in grams per bottle across hundreds of millions of bottles per year, even a one-gram reduction compounds into a large annual saving index. Labor substitution replaces manual bottle handling and standalone machine tenders with a supervisory crew, cutting the labor component of the consumption index from a double-digit seconds-per-thousand-bottles figure to a single digit. Electricity optimization combines servo drives, shortened oven pitch and heat recovery to lower the watt-hour component. Yield improvement lifts the good-bottle ratio, which raises the effective output for the same energy and resin draw. High-pressure air recovery closes the loop on the most energy-hungry utility in stretch blow molding by reclaiming a share of the blow air.
YuDa’s design choices map directly onto these levers. The FGX series minimizes the heater distance to 38.1 mm, which the factory rates as more than 30 percent electricity saving against conventional oven layouts. The cam-linking motion system shortens non-productive time in the mold cycle, supporting higher performance rate. The remote monitoring system lets engineers at the China headquarters read PLC data from a client site, which feeds preventive maintenance and protects the availability leg of OEE. Wanplas, the parent brand, extends shared service promises such as yearly complimentary spare parts and on-site commissioning across its factory network, which stabilizes the maintenance cadence that underpins a short recovery cycle.
Readers comparing suppliers should note that the same five levers appear in offerings from other PET blow molder makers such as Sidel, Krones and SIPA, but the cavity-to-output mapping, oven pitch and air-recovery architecture differ. The recovery cycle therefore depends less on brand and more on how aggressively each lever is implemented and how consistently the line is run near its rated utilization.
3. Capacity Utilization and Hour-Based Operating Windows
Utilization is the master variable of the recovery cycle. A line rated at 24,000 bottles per hour is only “high-speed” in economic terms when it actually runs those hours. The operating window is usually described by shift pattern. A single-shift operation accumulates about 2,000 running hours per year after accounting for weekends, planned maintenance and changeovers. A two-shift operation reaches about 4,000 running hours. A three-shift operation with limited downtime pushes toward 6,000 to 7,000 running hours per year. The recovery cycle shortens sharply as running hours climb because the fixed elements of ownership—depreciation of the machine, floor area, the engineering team—are spread across more bottles.
Within those annual hours, seasonal load swings are normal in beverage and water markets. Peak season may run the line at 90 to 95 percent of rated output, while the off-season may drop to 55 to 60 percent. A line planned only for peak demand will sit idle or run at low load for months, pushing realized utilization toward the 60 percent floor and lengthening the payback. A line planned with some headroom—sized so that peak season sits near 85 percent rather than 98 percent—keeps the off-season load higher and lifts the annual average utilization, which is the figure that drives the recovery cycle. The discipline is to size the cavity count to the annual average demand plus a modest peak buffer, not to the single highest week of the year.
The hour-based view also exposes the cost of unplanned stops. If a three-shift line loses two hours per day to jams, mold issues or air-system faults, it effectively behaves like a two-shift line for the recovery calculation even though the payroll and floor area are three-shift. This is why availability, the first leg of OEE, is inseparable from utilization. A high rated output means little if the line cannot sustain it across the planned running hours. The section on OEE below quantifies this.
Another nuance is the difference between nameplate utilization and effective utilization. Nameplate utilization divides actual bottles by rated bottles. Effective utilization divides salable bottles by rated bottles, which discounts the scrap and rework stream. Because yield sits inside effective utilization, the recovery cycle should always be modeled on effective utilization; otherwise the resin and energy spent on rejected bottles inflate the apparent throughput and understate the true payback period.
4. OEE Disaggregation for a High-Speed Blow Molding Line
Overall Equipment Effectiveness, or OEE, is the product of three factors: availability, performance and quality. For a high-speed PET line, availability typically ranges from 88 to 95 percent, performance from 90 to 97 percent and quality (good-bottle yield) from 98.5 to 99.7 percent. Multiplying these gives a composite OEE between roughly 78 and 91 percent. The recovery cycle is sensitive to OEE because every lost point is lost output that still consumed floor area and engineering capacity.
Availability captures planned and unplanned stops: mold changes, lamp changes, filter cleaning, air-leak repairs, material starvation and upstream or downstream blockages. A line changeover designed for 25 minutes protects availability far better than one requiring 60 minutes, especially in multi-SKU plants where changeovers recur weekly. Performance captures speed loss: the gap between rated cavities-per-minute and actual, caused by oven conditioning waits, stretch-rod timing drift, cooling limits or a filler bottleneck throttling the blow molder. Quality captures scrap and rework: off-weight bottles, base faults, neck defects, contamination and leaks. A yield rise from 98.5 to 99.7 percent looks small as a percentage but, at 48,000 bottles per hour, it converts millions of previously rejected bottles per year into salable output without extra resin beyond what was already drawn.
The engineering takeaway is that OEE is not a maintenance metric alone; it is a recovery-cycle metric. A line at 78 percent OEE must run visibly more rated hours to deliver the same salable volume as a line at 91 percent OEE, so its recovery band shifts upward. YuDa’s remote monitoring and modular design support the availability and performance legs: faults surface early, and modular mold-clamping units shorten changeover and service. The quality leg is supported by stable ovens and consistent preform conditioning, which is why the downstream partner matters as much as the blow molder itself.
For planning, a useful rule of thumb is to assume OEE near the middle of the band—about 84 percent—for a new installation, then climb toward 90 percent as the crew matures and preventive maintenance takes hold. Modeling the recovery cycle at 84 percent OEE rather than at the vendor’s best-case 91 percent prevents optimistic band placement and keeps the payback estimate conservative.
5. Lightweighting: The Single Largest Recovery Lever
Lightweighting deserves its own section because it is, in most index models, the largest single contributor to the cumulative saving index. The reference 500 mL water bottle preform conventionally weighed about 13.5 g. Through base geometry optimization, shorter neck finishes and refined wall distribution, the same bottle can be produced at 9.5 to 11 g, a reduction of 18 to 28 percent in unit resin consumption. Because resin is metered in grams across every bottle for the full life of the line, this lever repeats indefinitely and therefore dominates the annual saving index.
The mechanism is straightforward. A lighter preform needs less PET resin per bottle, so the resin component of the unit-bottle consumption index falls in direct proportion to the gram-weight reduction. A 24 percent reduction moves the resin index from a baseline of 100 down to about 76. That shift is larger than the labor or air contributions individually, which is why lightweighting is the first place a plant should look when accelerating recovery. The saving is also resilient: it does not depend on energy tariffs or wage levels, only on the physical gram weight and the annual bottle count.
Lightweighting interacts with other levers. Lighter preforms require less thermal energy to condition in the oven, so the electricity component of the consumption index also falls. They generate less cooling load, easing the chiller burden. They reduce the mass that the air conveyor must carry, trimming the compressed-air draw of conveyance. In other words, a successful lightweighting program does not only save resin; it cascades into the electricity and air components, which is why the cumulative saving index is greater than the resin line alone would suggest.
The constraint is bottle performance. A 9.5 g bottle must still survive filling pressure, drop tests, stacking and hot-fill or pasteurization where relevant. This is where neck finish choice matters: short-neck standards such as PCO1881 and the 29/25 lightweight neck reduce resin at the finish while preserving the sealing land, and base designs such as pentagonal or elliptic bases distribute load so the sidewall can thin. The plant should validate drop and top-load behavior at the target gram weight before committing, because a lightweight bottle that fails quality audits destroys yield and therefore damages the recovery cycle more than the gram saving helps it.
An additional benefit is sustainability reporting. Lower gram weight per bottle reduces the resin drawn from virgin or recycled feedstock, which supports food-grade rPET incorporation and carbon reporting. While the recovery cycle here is expressed in index points rather than carbon credits, the two move together: a lighter bottle is both cheaper to run and lighter to report, and rPET certification can open premium customer segments that improve the utilization side of the cycle.
6. Labor Substitution Through Full Automation
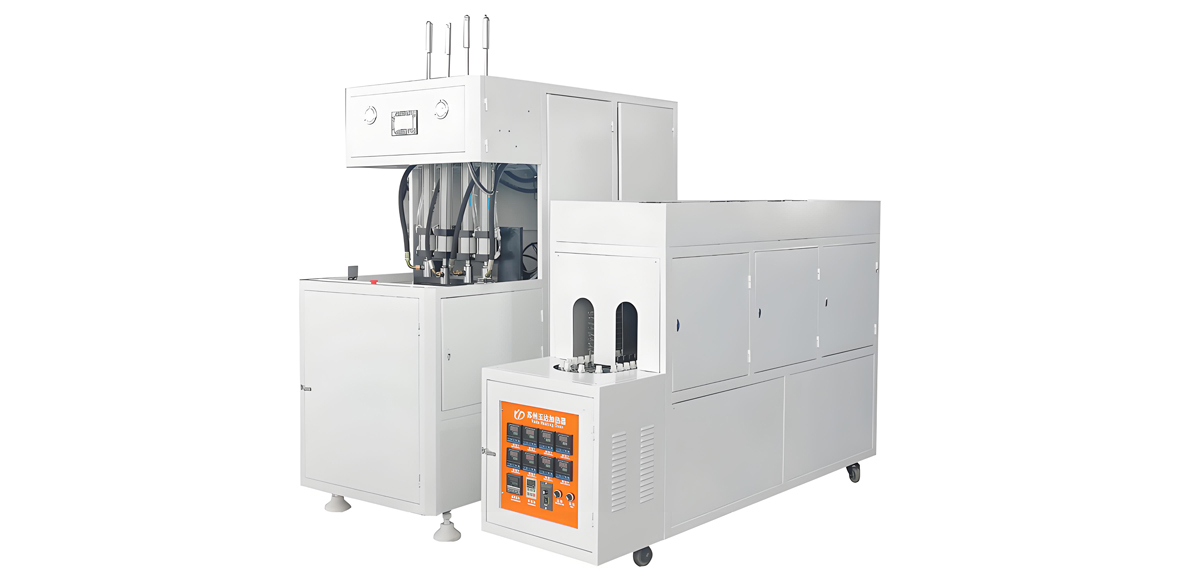
Labor substitution is the second pillar of the recovery cycle and the one most visible on the plant floor. A semi-automatic line typically requires twelve to twenty people across preform loading, manual bottle transfer, filling supervision, capping checks, labeling, packing, palletizing and quality sampling. A fully automatic high-speed line with integrated unscrambler, air conveyor, blow fill cap combi block, labeler, case packer and palletizer reduces the crew to three to five people whose role is supervision, changeover, sampling and exception handling. The labor component of the unit-bottle consumption index therefore drops from a double-digit seconds-per-person-per-thousand-bottles figure to a single digit.
Expressing labor in seconds-per-person-per-thousand-bottles rather than headcount alone is important because it normalizes for output. A semi-automatic line running 3,000 bottles per hour with fifteen people and a fully automatic line running 24,000 bottles per hour with four people are not comparable on headcount; they must be compared on the labor index. At 24,000 bottles per hour, four people equate to a labor index far below the semi-automatic baseline, and the gap widens as output rises because automation scales with the machine while manual handling scales with headcount. This is why the recovery advantage of full automation grows with cavity count.
The Wanplas group’s shared promises—complimentary yearly spare parts, free replacement of damaged parts within warranty and open-factory visits—reduce the hidden labor of maintenance logistics, because the plant is not bargaining for every seal and sensor. YuDa’s modular design further cuts the labor of service: a mold-clamping unit or a stretch-rod assembly can be swapped as a module rather than rebuilt in place, shortening both planned and unplanned stops. The human crew then spends time on optimization and quality rather than on wrench work, which protects the availability and quality legs of OEE.
One caution: labor substitution should not be modeled as a one-time headcount cut. The recovery cycle benefits from the recurring labor index every year the line runs, and the benefit compounds with utilization. A three-shift line compounds the saving across 6,000 to 7,000 running hours, while a single-shift line compounds it across only 2,000 hours, so the same automation yields a larger cumulative labor saving index at higher utilization. This is another reason the labor lever and the utilization lever are multiplicative rather than additive in practice.
7. Energy Profile and High-Pressure Air Recovery
Energy is the third lever and the one most sensitive to local tariffs, which is exactly why this article keeps it in physical units. The specific energy of a high-speed blow line is often expressed in the band of 0.10 to 0.18 kilowatt-hours per bottle-liter, so a 500 mL bottle sits near 0.05 to 0.09 kilowatt-hours, or 50 to 90 watt-hours per bottle, depending on oven efficiency, air recovery and whether the filler and compressor are included. The electricity component of the consumption index is dominated by the oven lamps and the high-pressure air compressors, with smaller draws from conveyors, labelers and palletizers.
High-pressure air recovery is the standout energy measure. Stretch blow molding uses air at roughly 30 to 40 bar to form the bottle, and after the bottle is blown the exhausted air still carries usable pressure. A recovery system captures that exhaust, filters and re-pressurizes a share of it, and feeds it back to the booster intake. The achievable reclaim is 30 to 40 percent of the blow air, which directly lowers the net compressed-air draw per bottle and, because compressing air is the largest electrical load, also lowers the watt-hour component. Combined with servo-driven stretch rods replacing pneumatic cylinders, the air and electricity indices both fall.
Servo stretch rods deserve emphasis. Pneumatic stretch uses compressed air for the rod motion; a servo stretch rod uses an electric servo, removing that air demand from the cycle and improving repeatability, which also helps yield. YuDa’s high-speed servo driving system is the mechanical enabler here. Heat recovery from the compressor and the chiller can be redirected to preform conditioning or to plant heating, trimming the site’s total energy draw even if it does not appear directly in the per-bottle number. Peak-valley electricity scheduling—running the most energy-intensive conditioning during off-peak tariff windows—further improves the effective energy position without altering the physical per-bottle figure.
For the recovery cycle, the key is that energy savings recur on every bottle and scale with utilization. A line that cuts the watt-hour index by a fifth and the air index by a third contributes a meaningful block of points to the cumulative saving index, and those points are stable across resin-price cycles because they are measured in physical units. This is why energy optimization is a dependable, tariff-independent contributor to a shorter payback band even though the local currency value of the saving varies by market.
8. Spare Parts and Maintenance Cadence
The recovery cycle is not only about recurring savings; it is also about avoiding recurring losses from wear and unplanned stoppage. The maintenance cadence of a high-speed blow line follows predictable component lives. Blow molds typically endure 3 to 5 million shots before refurbishment, so at 24,000 bottles per hour a mold set may need attention after roughly one to two years of heavy running. Stretch-rod seals wear faster and are commonly replaced every 6 to 12 months depending on duty and air quality. High-pressure valve islands, the precision manifolds that distribute blow air, usually last 2 to 3 years before overhaul.
These intervals define the preventive-maintenance calendar. A plant that replaces stretch-rod seals on a fixed 6 to 12 month schedule avoids the cascade failure where a leaking seal destabilizes blow pressure, raises scrap and eventually damages the valve island. A plant that waits for failure pays twice: the part and the lost output during the stop. Because lost output during an unplanned stop still consumes floor area and engineering capacity, the maintenance cadence directly protects the availability leg of OEE and therefore the recovery cycle.
Spare-parts strategy also matters. Holding a small buffer of high-wear items—seals, sensors, heating lamps, a spare stretch rod—converts a multi-day external-supply delay into a same-shift swap. Wanplas’s group commitment of complimentary yearly spare parts lowers the carrying cost of this buffer, and YuDa’s modular design lets a worn module be exchanged as a unit rather than diagnosed in place. The consumption index does not record maintenance labor directly, but the avoided downtime does show up as higher realized utilization, which is why maintenance is treated here as a recovery-cycle protector rather than a separate lever.
Finally, the chiller and compressor deserve their own care plan. The high-pressure air system is the most stressed utility; oil carryover or moisture in the air degrades seals and valves faster, so filtration and drying must be maintained to the specified standard. The oven lamps age and drift in output, so lamp rotation and replacement on a schedule keep the conditioning uniform and protect yield. A disciplined cadence is the difference between a line that holds 90 percent OEE and one that drifts toward 78 percent, and that drift is felt directly in the payback band.
9. Methodology: The Cumulative Saving Index
To keep the recovery cycle comparable across markets and immune to currency fluctuation, this article uses a cumulative saving index built on an explicit baseline. The semi-automatic baseline is assigned zero annual saving points, representing a line with none of the five levers implemented: standard gram weight, manual handling, conventional oven, no air recovery and typical yield. Each lever, when implemented on a fully automatic high-speed line, adds annual saving points. The points are ordinal and relative; they do not represent any currency amount.
The five levers and their indicative annual saving-point contributions are listed below. The numbers are calibrated so that a fully optimized line reaches a cumulative saving index in the low sixties, which aligns with the composite OEE and utilization needed for a Fast or Moderate band. A plant implementing only some levers lands proportionally lower, and the band placement in the next sections follows from that cumulative value combined with utilization.
Cumulative Saving Index by Lever
| Recovery lever | Annual saving index points (baseline 0) | Primary mechanism |
|---|---|---|
| Lightweighting | 22 | Preform gram weight 13.5 g to 9.5 to 11 g band |
| Labor substitution | 18 | Crew from 12 to 20 persons down to 3 to 5 persons |
| Electricity optimization | 10 | Servo drives, 38.1 mm oven pitch, heat recovery |
| Yield improvement | 6 | Good-bottle ratio from 98.5 to 99.7 percent |
| High-pressure air recovery | 8 | Reclaim 30 to 40 percent of blow air |
| Cumulative saving index | 64 | Fully optimized high-speed line |
The band mapping that follows uses the cumulative saving index together with utilization. A line at 95 percent utilization with a cumulative index above 50 lands in the Fast band; a line at 80 percent utilization with an index in the 35 to 50 range lands in the Moderate band; a line below 60 percent utilization or with an index below 30 lands in the Extended band. The exact month figure is intentionally withheld because it would require a currency basis; the band and the conditions that earn it are sufficient for planning.
It is worth stressing that the index is a planning instrument, not a substitute for the plant’s own metering. A plant should record actual grams per bottle, watt-hours per bottle, normal liters of air per bottle and labor seconds per thousand bottles, then compare those measured values against the baseline to compute its own realized index. The method’s strength is that it travels: the same index works whether resin is sourced locally or imported, whether energy is cheap or expensive, and whether wages are high or low, because the physical savings are real regardless of their local weighting.
10. Unit-Bottle Composite Consumption Index
The unit-bottle composite consumption index is the physical companion to the saving index. It compares a semi-automatic baseline line with a fully automatic high-speed line on four normalized metrics: resin in grams per bottle, electricity in watt-hours per bottle, compressed air in normal liters per bottle and labor in seconds of person-time per thousand bottles. The semi-automatic line is indexed to 100 on each metric; the fully automatic line shows the lower physical value and its resulting index. Lower is better on every row.
Composite Consumption Index: Semi-Automatic vs Fully Automatic High-Speed
| Metric (per 500 mL water bottle) | Semi-automatic baseline | Fully automatic high-speed | Index (semi-auto = 100) |
|---|---|---|---|
| Resin, g per bottle | 13.5 | 10.2 | 75.6 |
| Electricity, Wh per bottle | 95 | 62 | 65.3 |
| Compressed air, NL per bottle | 220 | 150 | 68.2 |
| Labor, sec-person per 1,000 bottles | 16.0 | 3.5 | 21.9 |
The resin index of 75.6 reflects the lightweighting lever; the electricity index of 65.3 reflects servo drives, the shortened oven pitch and heat recovery; the air index of 68.2 reflects high-pressure air recovery; and the labor index of 21.9 reflects full automation. Read together, the four indices explain the cumulative saving index of section nine: the physical drops translate into ordinal points. A plant can therefore track recovery progress by watching these four indices move month over month as lightweighting, automation and air recovery are rolled out.
One practical note: the indices above are reference values at the 500 mL water bottle. A 1.5 L bottle carries a higher gram weight and air draw, so the absolute numbers rise, but the index relationship between semi-automatic and fully automatic stays similar because the levers scale with bottle size. For mixed-SKU plants, the indices should be computed per SKU and then volume-weighted to a plant-level composite, which prevents a small lightweight SKU from masking a heavy legacy SKU.
11. Payback Period Banding Without Currency
Because this article avoids any currency figure, the recovery outcome is reported as a band rather than a month-and-amount pair. Three bands are used. The Fast band covers recovery within fewer than 18 months and is earned by a line combining high utilization, high OEE and most of the five levers. The Moderate band covers 18 to 30 months and is the typical outcome for a well-run line at around 80 percent utilization with standard lightweighting. The Extended band covers more than 30 months and applies when utilization falls toward the 60 percent floor, OEE drifts low, or only a few levers are implemented.
The banding is deliberately condition-based. A line can be placed in a band by answering three questions: what is the annual average utilization (60, 80 or 95 percent)? What is the realized OEE (near 78, 84 or 91 percent)? What is the cumulative saving index (below 30, 35 to 50, or above 50)? The intersection of those answers determines the band. This keeps the planning discussion honest: a vendor may quote a best-case Fast band, but the plant should model its own Moderate or Extended band from its realized conditions.
It is entirely acceptable to state the band in months because months are a measure of time, not currency. For example, under 80 percent utilization with standard lightweighting and air recovery, payback typically falls in the 18 to 30 month band. Under 95 percent utilization with full lever implementation, it can fall below 18 months. Under 60 percent utilization with partial levers, it extends beyond 30 months. These month ranges are planning anchors that any plant manager can verify against their own metering without ever invoking a currency amount.
The band method also handles uncertainty gracefully. Rather than a false-precision point estimate that breaks the moment resin or energy weights shift, the band communicates the realistic spread. A conservative planner uses the upper edge of the band; an optimistic planner uses the lower edge; both stay within a defensible, currency-free frame. This is the discipline that protects the article from the compliance risk of quoting any monetary figure while still giving the reader an actionable recovery expectation.
12. Three-Tier Scenario Matrix
The matrix below combines three rated outputs (12,000, 24,000 and 48,000 bottles per hour) with three utilization levels (60, 80 and 95 percent) and reports the expected payback band. The cumulative saving index is assumed fully implemented (about 64 points) for all cells; the only variable is utilization and its effect on how many bottles the rated output actually delivers. Higher rated output at equal utilization delivers more annual volume, which shortens the band; higher utilization at equal rated output does the same.
Payback Band Matrix: Rated Output by Utilization
| Utilization | 12,000 bph | 24,000 bph | 48,000 bph |
|---|---|---|---|
| 60 percent | Extended | Extended | Moderate |
| 80 percent | Moderate | Moderate | Moderate |
| 95 percent | Moderate | Fast | Fast |
The matrix shows the expected pattern: at 60 percent utilization even large lines struggle into the Moderate band because the annual volume is too low to compound the saving index quickly, while at 95 percent utilization the 24,000 and 48,000 bottles-per-hour lines reach the Fast band. The 12,000 bottles-per-hour line sits in the Moderate band even at 95 percent utilization because its absolute annual volume is smaller, so the index compounds more slowly despite excellent utilization. This is the core lesson: rated output and utilization are both required; a small line at perfect utilization still recovers more slowly than a large line at good utilization.
The matrix assumes the full lever set. If a plant implements only lightweighting and labor substitution (about 40 points) the bands shift one step upward—Fast becomes Moderate, Moderate becomes Extended—so the lever set and the band are coupled. A planner should therefore read the matrix as the best case for a fully optimized line and then downgrade the band according to how many levers are actually in place. The discipline of coupling levers to bands prevents the common error of quoting a Fast band while running only half the optimizations.
13. Risk Factors That Lengthen the Payback
Several risks can push a line from the Moderate band into the Extended band, and they should be assessed before purchase rather than discovered after commissioning. The first is order seasonality. If demand collapses to 55 percent of rated output for several months each year, the annual average utilization may sit near 60 percent even if peak weeks hit 95 percent, and the matrix places such a line in the Extended band. Demand smoothing through contracted off-season production or a second SKU that peaks in the opposite season protects utilization.
The second risk is frequent bottle-shape changeovers. Each mold swap costs 25 to 60 minutes of stopped time, and in a multi-SKU plant with daily changeovers that downtime accumulates into a meaningful availability loss. Rapid-change tooling, shared mold bases and pre-heated standby molds compress this loss. The third risk is rPET blending. Incorporating recycled PET changes melt behavior and can raise scrap until the process stabilizes, temporarily lowering yield and therefore the quality leg of OEE. A controlled ramp and online inspection mitigate this, and rPET certification can later open premium segments that lift utilization.
The fourth risk is local grid capacity. A high-speed line with compressors and chillers draws significant power; if the site supply cannot sustain the rated load, the line is throttled below its cavity count and utilization falls. The fifth risk is water supply and wastewater treatment. Filling and cleaning consume and discharge water; a limited supply or strict discharge limit caps the filler speed and therefore the effective output of the combi block. These utilities must be verified at the rated output, not at a comfortable average, because the recovery cycle is set by peak sustainable operation.
A sixth, softer risk is skills. A line run by an inexperienced crew will not reach the OEE band assumed in the matrix, because performance and quality suffer from mistuned ovens, incorrect stretch timing and slow fault response. YuDa’s remote monitoring and Wanplas’s commissioning and training support reduce this risk, but the plant must still build internal competence. The recovery cycle is ultimately delivered by people operating the levers consistently, not by the levers existing on paper.
14. Ten Measures to Accelerate Recovery
The following ten measures accelerate the recovery cycle by adding points to the cumulative saving index or by protecting utilization and OEE. Each is rated for implementation difficulty as Low, Medium or High, so a plant can sequence them from quick wins to longer programs. The contribution points are indicative and additive with the lever table in section nine.
Acceleration Measures, Contribution and Difficulty
| Measure | Contribution points | Implementation difficulty |
|---|---|---|
| Lightweight neck design (PCO1881 / 29-25 short neck) | 12 | Medium |
| Rapid mold change (SMED, pre-heated standby molds) | 6 | Medium |
| Preventive maintenance program on fixed cadence | 5 | Low |
| Compressor heat recovery to preform conditioning | 4 | Medium |
| Peak-valley electricity scheduling | 5 | Low |
| Shared mold base across multiple SKUs | 3 | Medium |
| Online leak and defect inspection | 4 | Medium |
| rPET certification for premium customer segments | 6 | High |
| Servo stretch rod retrofit replacing pneumatic | 3 | Medium |
| Centralized vacuum and air management | 3 | Low |
The first three measures—lightweight neck design, rapid mold change and preventive maintenance—are the highest-leverage for most plants and should be prioritized. Lightweighting alone can add twelve points, which combined with the base levers pushes the cumulative index past 50 and into Fast-band territory at high utilization. Rapid mold change protects availability in multi-SKU operations, and preventive maintenance protects both availability and quality. The Low-difficulty items—preventive maintenance scheduling, peak-valley scheduling and centralized air management—are quick wins that any plant can start within weeks and that require no capital beyond minor controls work.
The High-difficulty item, rPET certification, is different in kind: it does not lower the per-bottle physical index much, but it can raise utilization by opening premium segments that pay for higher-volume contracts, and it supports sustainability reporting that some brand owners now require. For plants supplying major beverage brands, rPET certification is increasingly a utilization protector rather than a pure efficiency lever, which is why it earns six points despite its difficulty. Wanplas’s Polyretec factory, which builds PET washing and pelletizing lines, is the group resource for food-grade rPET feedstock integration, so a plant can source the recycling side and the blowing side from one brand network.
15. Compliance and Standards Framework
A recovery cycle is only durable if the line meets the food-contact and energy standards that brand owners and regulators require. The relevant framework for a PET bottle line centers on food safety and energy management. ISO 22000 and FSSC 22000 govern the food safety management system of the filling environment, which the blow fill cap combi block sits inside; because the bottle is formed and filled in one clean monoblock, the standard’s hygiene expectations are easier to meet than on a split line with open bottle transit. GB 4806.7 is the Chinese food-contact plastics standard that specifies limits for substances migrating from PET into the contents, and EU 10/2011 is the European regulation with its own specific migration and overall migration limits for plastic food-contact materials.
ISO 50001 is the energy management standard, and it is directly relevant to the recovery cycle because its plan-do-check-act loop is exactly the discipline that sustains the electricity and air indices over time. A plant certified to ISO 50001 is more likely to keep the oven pitch optimized, the air recovery maintained and the compressor heat recovered, which protects the energy lever from drift. For export-oriented plants, demonstrating conformance with the relevant food-contact regulation of the destination market is also a utilization protector: it prevents shipment holds that would otherwise idle the line and lengthen the payback.
Beyond compliance, the standards framework signals maturity to customers. A line that can document ISO 22000 or FSSC 22000 alignment, GB 4806.7 or EU 10/2011 conformance for its bottles, and ISO 50001 energy discipline is a lower-risk supplier, which can win contracts that keep utilization high. Because utilization is the master variable of the recovery cycle, standards compliance is not a side issue; it is a quiet contributor to the Fast band by keeping the line fed with orders and free of regulatory stoppages.
Wanplas and its YuDa factory position the PET blow molding program within this standards context, and the group’s shared quality promise—refund plus compensation if quality fails to the agreed standard—aligns the supplier’s incentive with the plant’s need for stable yield. The recovery cycle thus rests on three legs that this article has separated for clarity but that in practice reinforce one another: physical savings (resin, electricity, air, labor), operational discipline (OEE and utilization) and compliance (food safety and energy standards).
Frequently Asked Questions
What exactly defines a fully automatic high-speed PET bottle production line?
A fully automatic high-speed PET bottle production line centers on a rotary stretch blow molding machine with six to twenty-four cavities producing 12,000 to 72,000 bottles per hour at the 500 mL water reference, integrated with automatic preform feeding, air conveyance, filling, capping, labeling, packing and palletizing. The defining trait is that the entire chain runs with three to five operators instead of twelve to twenty, and that blow fill cap combi block configurations merge blowing, filling and capping into a single monoblock for the shortest possible empty-bottle transit and the lowest energy and footprint burden.
Why is lightweighting the largest single lever in the cost recovery cycle?
Resin is the dominant recurring physical input per bottle. Reducing a 500 mL water bottle preform gram weight from 13.5 g to a 9.5 to 11 g band lowers unit resin consumption by 18 to 28 percent. Because that saving repeats on every bottle for the entire service life of the line, it compounds across the full annual volume and therefore drives the cumulative saving index more strongly than any one-time or partial improvement. Lightweighting also reduces the compressed-air and cooling burden because lighter preforms require less thermal energy to condition.
How is the payback period expressed without referencing currency?
The methodology uses an index-based cumulative saving index where the semi-automatic baseline starts at zero saving points and each engineering lever adds points, plus a unit-bottle composite consumption index measured in grams of resin, watt-hours of electricity, normal liters of compressed air and seconds of labor per thousand bottles. The cost recovery outcome is then reported only as a band: Fast (below 18 months), Moderate (18 to 30 months) or Extended (above 30 months), each tied to explicit utilization and OEE conditions rather than to any monetary amount.
What role does high-pressure air recovery play in the recovery cycle?
Stretch blow molding consumes high-pressure air that, after blowing each bottle, still carries usable pressure. A high-pressure air recovery system captures and reconditions 30 to 40 percent of that blow air back into the intake of the booster compressor, cutting the net compressed-air draw per bottle. Combined with servo-driven stretch rods replacing pneumatic cylinders, the electricity and air components of the unit-bottle consumption index both fall, contributing roughly eight index points to the cumulative saving index.
Which risk factors can stretch the payback period beyond the Moderate band?
The main risk factors are order seasonality that drops utilization below the 60 percent floor for long stretches, frequent bottle-shape changeovers with 25 to 60 minute mold swaps, rPET blending that introduces yield fluctuation until the process stabilizes, local grid capacity limits that cap achievable output, and inadequate water supply or wastewater treatment that constrains filling and cleaning. Any one of these can pull the realized utilization or yield below the assumptions behind a Moderate band and push the line into the Extended band.
Does a blow fill cap combi block recover faster than a split line?
In most index-based comparisons the combi block recovers faster because it eliminates the separate bottle buffer, the secondary air conveyor and the redundant transfers between blowing and filling, lowering both the energy and labor components of the unit-bottle consumption index and improving overall equipment effectiveness by removing a hand-off loss. The split line remains attractive when multiple fillers or bottle formats must be flexibly shared, but for a single high-volume SKU the monoblock typically lands in a lower payback band at equal utilization.
Conclusion
The cost recovery cycle of a fully automatic high-speed PET bottle production line is best understood as the accumulation of physical savings across resin, electricity, compressed air and labor, compounded by utilization and protected by OEE and compliance. By expressing the cycle through a cumulative saving index with a semi-automatic baseline of zero points and a unit-bottle composite consumption index in grams, watt-hours, normal liters and labor seconds, a plant can plan and track recovery without ever referencing a currency amount. The engineering levers are clear: lightweighting toward a 9.5 to 11 g preform, full automation cutting the crew to three to five, servo drives and high-pressure air recovery reclaiming 30 to 40 percent of blow air, and a yield climb toward 99.7 percent. The band method then places any line into Fast, Moderate or Extended territory based on its rated output, utilization and lever set, with the matrix showing that 24,000 and 48,000 bottles-per-hour lines reach the Fast band at 95 percent utilization while 60 percent utilization pushes even large lines toward Extended.
For the plant manager, the practical path is to size the cavity count to the annual average demand with modest peak headroom, implement lightweighting and automation first, protect availability with preventive maintenance and rapid changeover, and certify to the food-contact and energy standards that keep orders flowing. YuDa, a Wanplas factory with more than twenty years in PET bottle blow molding and twenty-plus patents, offers the FGX high-speed series, the 38.1 mm short-pitch oven and remote monitoring that operationalize these levers, while the broader Wanplas network—including Polyretec for food-grade rPET and the main brand for blow fill cap combi blocks—supplies the adjacent pieces from one standards-aligned source. The recovery cycle is therefore not a gamble on a single number but a measurable, repeatable outcome of choices made before commissioning and discipline maintained afterward.