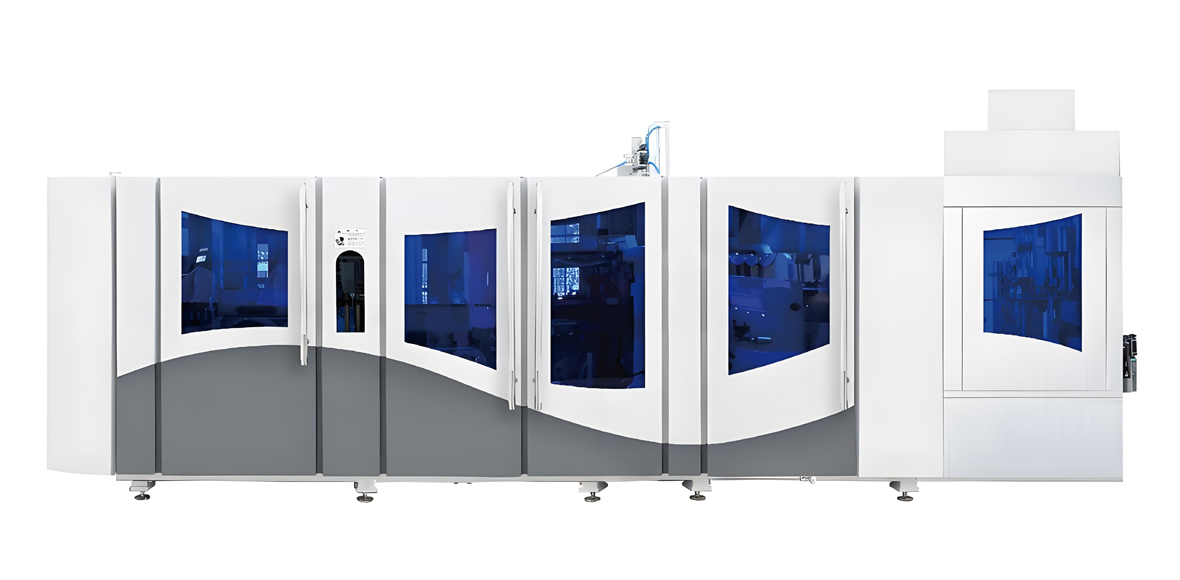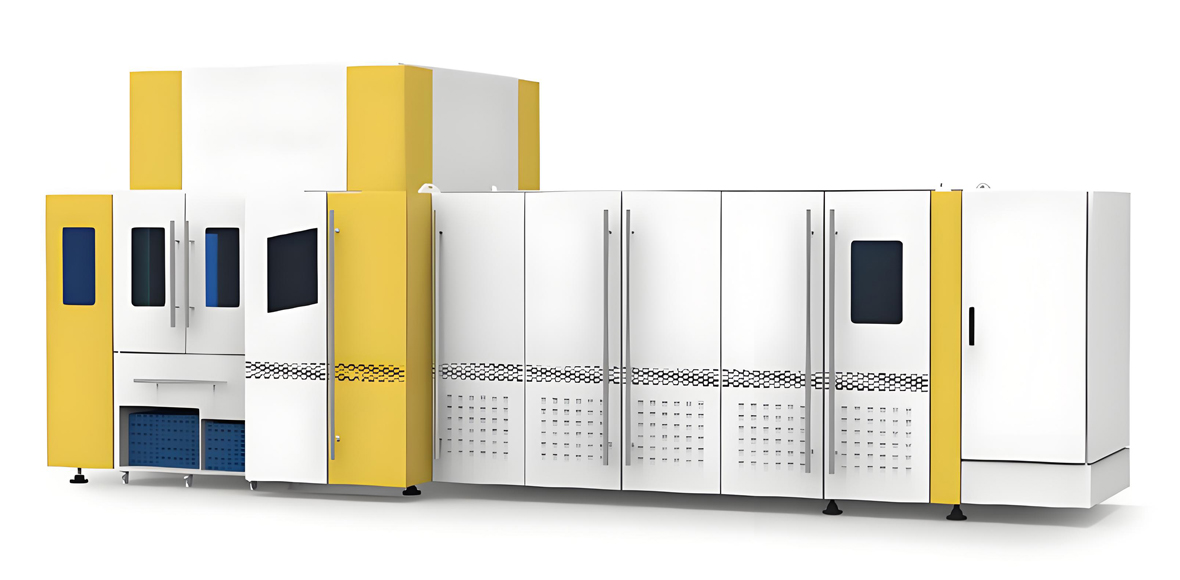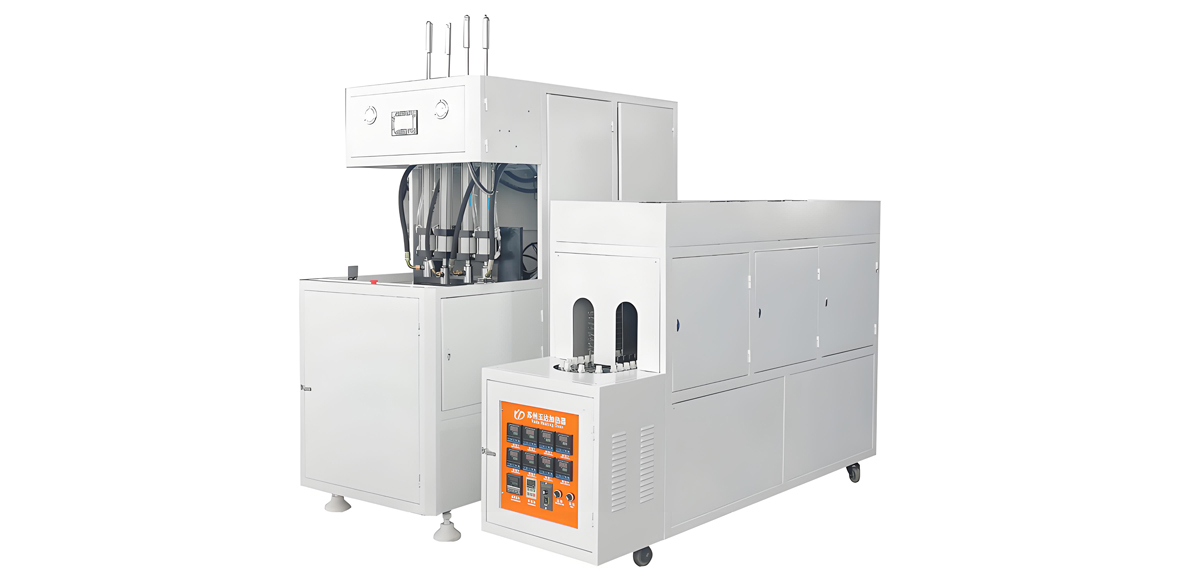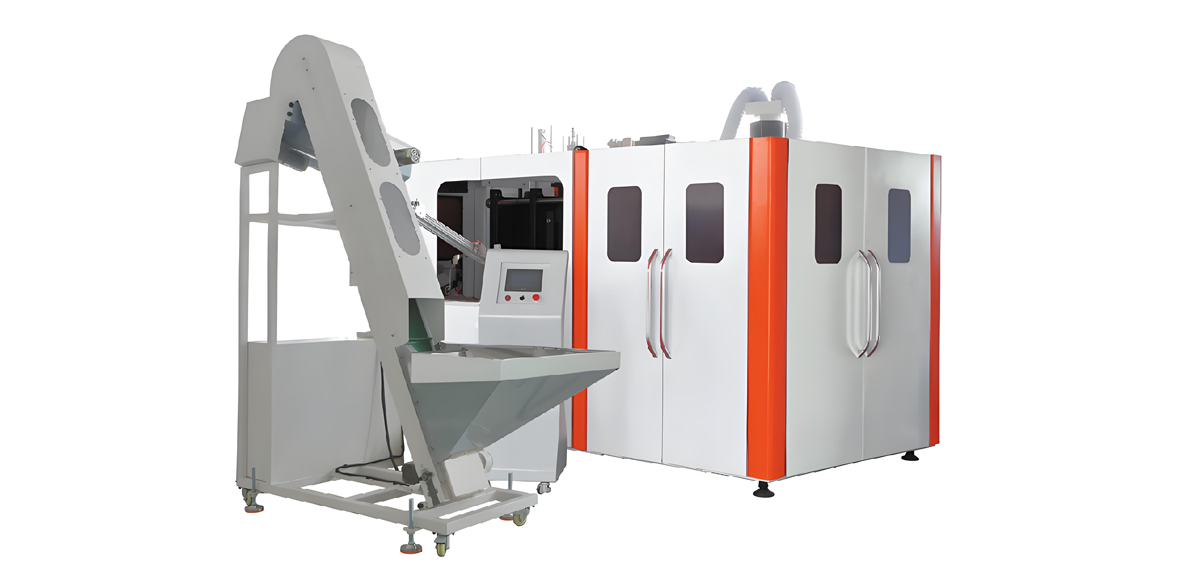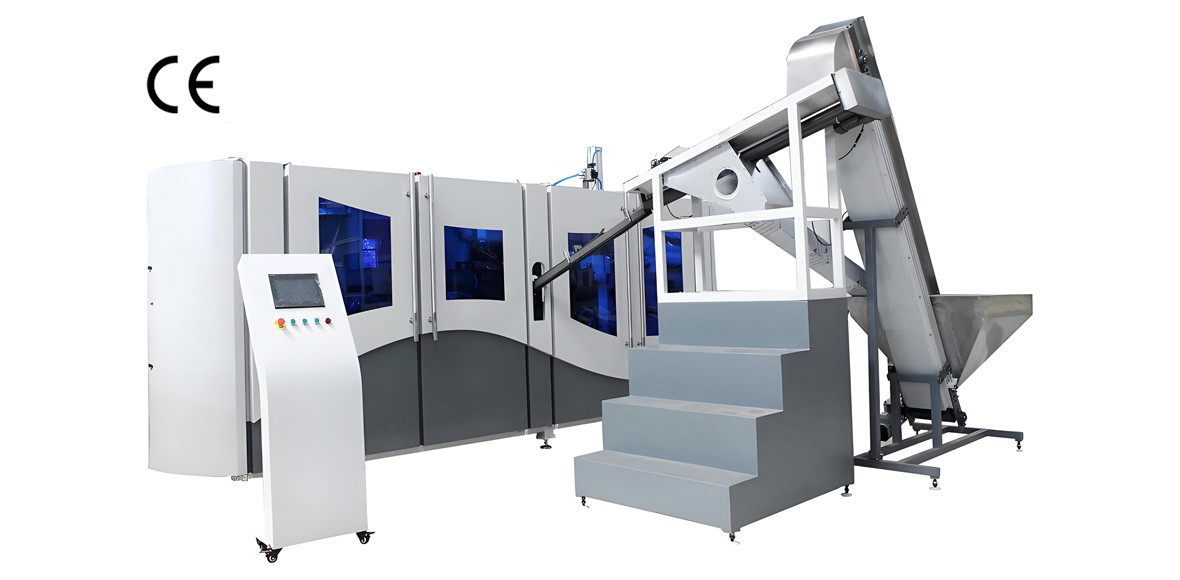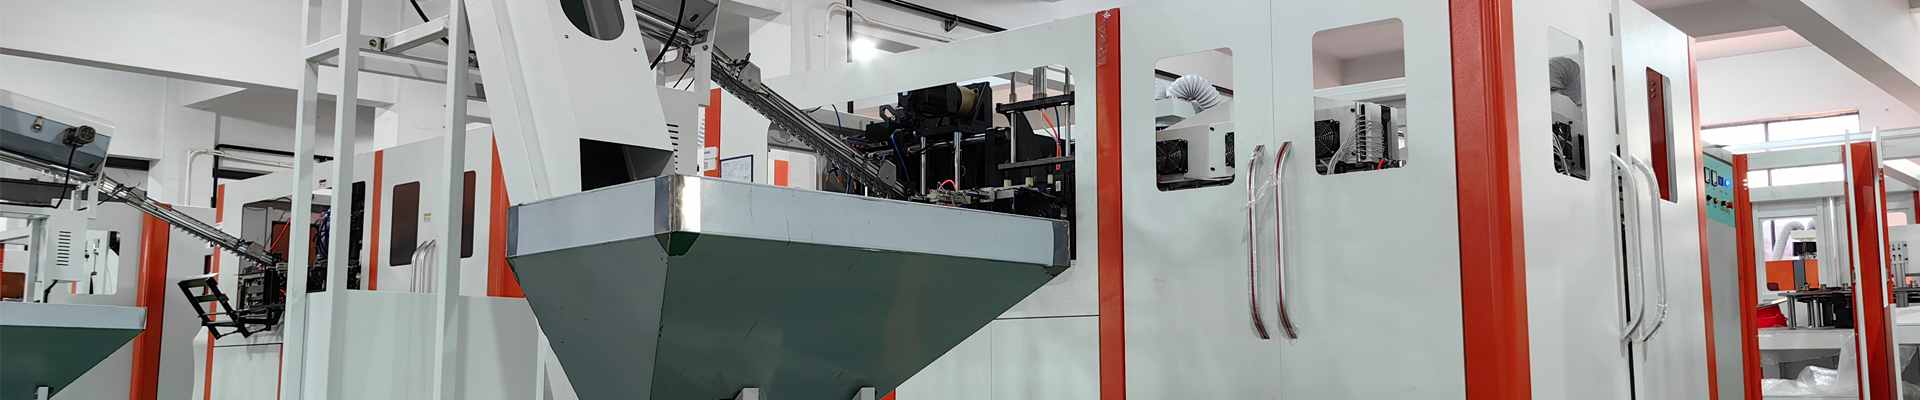
Energy consumption of PET blow molding equipment has become a central engineering and commercial topic for beverage, edible oil, daily chemical, and condiment producers because the stretch blow molding process concentrates large electrical and compressed-air loads into a compact production cell. For any filling plant, the bottle blow module is no longer a passive upstream step; it is one of the largest contributors to the plant’s specific energy and to the operating budget that must be controlled each year. Understanding where the power goes, and which cost saving methods deliver the fastest return, is the difference between a line that merely runs and a line that runs competitively.
YuDa Machinery, a Wanplas factory and one of the top two PET bottle blow machine manufacturers in China with more than 20 years of experience and equipment running in 60 plus countries, designs its machines around this exact problem. The company holds 20 plus patents and builds full automatic, semi-automatic, and high-speed PET stretch blow molding lines for water, carbonated soft drinks, edible oil, and daily chemical containers. This article analyzes the energy structure of PET blow molding equipment, quantifies each load with physical units and percentages rather than guesswork, and presents a prioritised set of cost saving methods that plant engineers can act on.
Throughout this guide we express savings in kilowatt hours per 1000 bottles, installed kilowatts, compressed air volume in cubic meters per hour or minute, high-pressure air in normal cubic meters, and relative reductions expressed as percentages or index points. We avoid vague claims and instead frame every recommendation against a measurable baseline. By the end, a production manager should be able to build an energy map of the blow molding cell, rank improvement projects by power saving percentage, implementation difficulty, relative investment grade, and payback window.
Energy Consumption Structure of PET Blow Molding Equipment
A PET stretch blow molding line converts amorphous PET preforms into oriented bottles by reheating the preform in an infrared oven and then stretching and blowing it inside a blow mold. The total energy of the cell is the sum of several independent loads, and the share of each load changes with machine speed, bottle size, and ambient condition. A correct cost saving program must start with this breakdown, because attempting to optimize a small load while ignoring the dominant one wastes engineering effort.
Breakdown of Electrical Load
The heating oven is consistently the largest single consumer. In a typical two-step reheat stretch blow molding machine, the infrared lamps that bring the preform from room temperature to the 95 to 115 degree Celsius stretch window account for roughly 50 to 70 percent of total electricity. The high-pressure air compressor that supplies 2.5 to 4.0 MPa blow air is the second largest, typically 15 to 30 percent, because compressing air to bottle pressure is thermodynamically expensive. Low-pressure pneumatic actuation at 0.6 to 0.8 MPa, servo and mechanical transmission, the chiller and mold temperature control, and conveyors and auxiliaries make up the remainder.
Why the Heating Oven Dominates
The oven dominates because PET is a poor thermal conductor and the preform wall must be heated from the outside in, with precise temperature profiling along its length. Infrared energy is absorbed in the preform skin and conducted inward, which means a large installed lamp power is needed even though only a fraction becomes useful thermal energy in the preform. Reflection losses, oven ventilation, and standby heating during idle all add to the bill. Any reduction in heater distance, improvement in reflector efficiency, or upgrade to higher-efficacy lamps therefore moves the largest number on the energy ledger.
How Line Speed Changes the Load Share
The percentage split between loads is not fixed; it shifts with machine speed and bottle size. At low output, the fixed overhead of the oven standby, control systems, and auxiliaries represents a larger fraction of each bottle, so the heating oven share can fall toward 50 percent while the constant electrical loads grow in relative terms. At high output, the oven runs near its thermal limit and its share climbs back toward 70 percent, while the compressor share stays roughly proportional to bottle count. Large-volume bottles carry more preform mass per unit, raising oven demand, whereas small water bottles spread the same oven power over more pieces and report a lower kWh per 1000 bottles. A plant should therefore benchmark its own line at its real product mix rather than copy a generic table, because the index point baseline is only meaningful against the actual bottle and speed it produces.
| Load category | Typical share of total electricity | Primary physical driver | Optimization leverage |
|---|---|---|---|
| Heating oven (infrared lamps) | 50 to 70 percent | Preform gram weight, lamp efficacy, residence time | Very High |
| High-pressure air compressor | 15 to 30 percent | Blow pressure, air volume, leakage | High |
| Low-pressure pneumatic (0.6 to 0.8 MPa) | 3 to 8 percent | Actuator count, duty cycle | Medium |
| Servo and mechanical transmission | 5 to 12 percent | Motion profile, recovery | Medium |
| Chiller and mold temperature control | 5 to 12 percent | Cooling water temperature, ambient | Medium |
| Conveyor and auxiliaries | 2 to 5 percent | Transport length, options | Low |
Heating System Energy Saving Methods
The heating oven offers the largest and most repeatable cost saving opportunity on PET blow molding equipment. The objective is to deliver exactly the thermal energy the preform needs for correct stretching, with minimal loss to the surroundings and minimal standby waste. YuDa’s design philosophy minimizes the heater distance to 38.1 millimeters, which alone saves more than 30 percent of electricity compared with conventional wider-spaced ovens.
Infrared Lamp Arrangement and Power Distribution
Infrared lamps are arranged in heating zones along the preform path, and each zone must be powered according to the preform section it addresses. The neck and support ring need little energy, while the body and base need the most. A well-distributed power plan avoids overheating one zone while underheating another; imbalance forces the controller to raise total lamp power and increases kWh per 1000 bottles. Modern ovens use independently controlled zones so the operator can tune the profile per bottle, and the same profile can be stored as a recipe for repeatable changeovers.
Reflection, Insulation, and Preform Rotation
High-reflectivity reflector plates behind each lamp return stray radiation to the preform instead of dissipating it as heat in the oven cabinet. Insulated oven walls and a controlled exhaust reduce the thermal load on the factory. Preform rotation as it passes the lamps is essential: a stationary preform develops hot and cold sides, leading to uneven stretching and higher reject rates that indirectly raise energy per good bottle. Uniform rotation lets the lamp power be lowered while maintaining a consistent temperature field.
Preheat Temperature Window and Lamp Aging
PET should enter the blow station at roughly 95 to 115 degrees Celsius in the stretch window, where the material is warm enough to orient but not so hot that it crystallizes or sticks. Running above the window wastes energy and risks defects; running below forces the material to be blown cold, increasing scrap. Infrared lamps lose output gradually as the filament ages, so a lamp that appears lit may deliver only a fraction of its rated power. A scheduled replacement program based on running hours, verified by output measurement, keeps oven efficiency from silently drifting upward in kWh per 1000 bottles.
Upgrading to LED or Short-Wave Infrared
Conventional medium-wave infrared lamps emit a broad spectrum, much of which PET does not efficiently absorb. Short-wave infrared and emerging LED-based heating concentrate energy in the absorption band of PET, improving conversion efficiency. Field and laboratory comparisons show lamp technology upgrades can cut oven electricity by around 40 percent, though the exact figure depends on preform color, gram weight, and line speed. The table below summarizes the heating upgrade route.
| Heating measure | Conventional practice | Optimized practice | Energy effect |
|---|---|---|---|
| Heater spacing | Wide, 50 plus mm | Minimized to 38.1 mm | More than 30 percent less electricity |
| Reflector and insulation | Standard plate | High-reflectivity, insulated cabinet | Reduced stray loss |
| Lamp spectrum | Medium-wave infrared | Short-wave or LED heating | Up to 40 percent oven saving |
| Lamp maintenance | Run to failure | Hour-based scheduled replacement | Stable kWh per 1000 bottles |
High-Pressure Air Recovery
High-pressure air is the second largest load on PET blow molding equipment, and a large portion of the air used for the final blow is still at usable pressure when the bottle is finished. Capturing that air and returning it to the network is one of the most effective cost saving methods available, with no change to bottle quality.
Working Principle of Secondary Blow Recovery
In the stretch blow cycle, high-pressure air first pre-blows the preform and then final-blows it against the mold wall at 2.5 to 4.0 MPa. When the mold opens, the residual high-pressure air inside the finished bottle is normally vented to atmosphere. A recovery valve instead captures this residual air into a buffer tank, where it is cleaned and stored at reduced but still useful pressure. Because the recovered air has already been compressed, returning it to the system avoids a corresponding amount of new compression work by the compressor.
Multi-Stage Recovery Schemes
Recovery can be implemented at several levels. A single-stage scheme captures residual blow air into one buffer tank and feeds it back into the low-pressure or pre-blow side, returning 30 to 40 percent of the high-pressure air. A two-stage scheme adds a second tank and pressure step, reaching 40 to 50 percent. A full multi-stage cascaded scheme with dedicated tanks for each pressure level can exceed 50 percent recovery on suitable bottle programs. The table compares the options.
| Recovery scheme | Air recovery rate | Where recovered air is used | Relative complexity |
|---|---|---|---|
| Single-stage recovery | 30 to 40 percent | Low-pressure and pre-blow side | Low |
| Two-stage recovery | 40 to 50 percent | Pre-blow and partial high-pressure | Medium |
| Full multi-stage cascade | 50 percent plus | All pressure tiers with buffer tanks | High |
The benefit is twofold: total compressed air consumption drops by the recovery rate, and the high-pressure compressor runs fewer hours at the same output. On a line producing water bottles around the clock, recovering 30 to 40 percent of blow air is often the single fastest payback project after the oven upgrade.
Compressed Air System Optimization
Beyond recovery, the compressed air system itself contains several cost saving opportunities that require no compromise in bottle quality when applied with engineering judgment.
Pressure Downscaling by Bottle Geometry
Many lines are set to the maximum 4.0 MPa by default, but a given bottle may not need it. Blow pressure can often be reduced toward 2.5 to 3.0 MPa when the bottle volume, base design, and stretch ratios permit full orientation. The feasibility criterion is simple: if the bottle reaches target top load, base clearance, and burst performance at a lower set pressure, that pressure is valid. Downscaling from 4.0 MPa to 3.0 MPa can cut compressor specific energy by a meaningful double-digit percentage, because compression work rises steeply with pressure.
Pipeline Pressure Drop and Leakage
Pressure drop between the compressor and the blow valve wastes compressor capacity; piping should be sized so the drop stays under roughly 0.2 MPa at full flow. Adequate buffer tank volume smooths demand peaks and lets the compressor operate in its efficient band instead of hunting. Leakage is the silent cost: a measured leakage rate above 10 percent of total generation is classified as high risk, because the compressor must run extra hours to cover air that never makes a bottle. A routine leak detection and repair program, using ultrasonic survey at shift change, is a low-cost, high-return action.
| Parameter | Typical starting point | Target | Energy rationale |
|---|---|---|---|
| Blow pressure, 500 mL water bottle | 4.0 MPa | 2.5 to 3.0 MPa | Lower compression work |
| Pipeline pressure drop | 0.3 to 0.5 MPa | Below 0.2 MPa | Less compressor margin |
| Leakage rate | Above 10 percent (high risk) | Below 5 percent | Eliminates wasted generation |
| Air drying and filtration class | Overspecified | Matched to dew point need | Right-sized auxiliary load |
Preform and Lightweighting Strategy
The preform is where energy and material meet. Every gram of preform mass must be heated in the oven and then cooled in the mold, so reducing gram weight reduces both the dominant electrical load and the cooling load at the same time.
Preform Gram Weight Optimization
Lightweighting replaces an oversized preform with the minimum mass that still delivers the required bottle performance. A well-designed lightweight preform keeps wall distribution and top load while dropping gram weight by a single or double-digit percentage versus an older design. Because the oven energy scales with the thermal mass to be heated, a lighter preform needs less lamp power and shorter residence, lowering kWh per 1000 bottles directly. The same bottle count then consumes less raw PET, contributing to material cost saving as well.
Stretch Ratio and Wall Thickness Distribution
Correct stretching converts the preform into a thin, strong, biaxially oriented bottle. Typical targets are an axial stretch ratio of 2.8 to 3.2 and a radial stretch ratio of 3.5 to 4.5. When stretching is optimized, the preform can be lighter yet still meet performance, which compounds the oven saving. Crystallinity must be controlled: too little orientation leaves a weak bottle, too much heat or over-stretch causes haze and brittleness. The wall thickness distribution is the visible proof of a good program, and it is best verified with a sectioned bottle rather than assumed from settings.
Lightweighting is the only cost saving method that reduces the two largest loads at once: it lowers oven electricity through reduced thermal mass and lowers cooling duty through reduced heat to remove, while also cutting raw material per bottle.
Mold and Cooling Optimization
The blow mold must be cooled so the hot, oriented bottle solidifies quickly and releases cleanly. Cooling performance influences cycle time, and cycle time influences how many bottles are made per kilowatt hour.
Cooling Water Temperature
Mold cooling water is normally maintained around 8 to 15 degrees Celsius. Colder water removes heat faster, supporting shorter cycles, but it also raises chiller load, so the optimum is a balance rather than the coldest possible setting. Bottle base cooling deserves special attention because the thick base retains heat longest; insufficient base cooling prolongs the cycle and can cause deformation. A stable, filtered water supply with correct flow to every cavity prevents hot spots that slow the line.
Chiller COP and Free Cooling
The chiller’s coefficient of performance, or COP, determines how much cooling is delivered per kilowatt of electrical input. Matching chiller capacity to the actual thermal load, rather than oversizing, keeps it in its efficient band. In cooler climates or seasons, a cooling tower or free cooling loop can supply much of the mold cooling without running the compressor, cutting the cooling load by a single-digit to low double-digit percentage. Where the plant has access to a low-cost free cooling source, routing mold cooling through it during cold months is a straightforward saving.
Servo and Transmission Efficiency
The stretch and clamp motions of a blow molding machine can be driven by pneumatics or by servo electric systems, and the choice has a direct energy consequence.
Servo vs Pneumatic Stretch Rod
A pneumatic stretch rod consumes low-pressure air continuously and offers limited control over the stretch speed profile. A servo-driven stretch rod draws electrical power only during motion and can return energy on the return stroke through regenerative drive technology. Beyond energy, the servo gives a precise, repeatable stretch profile that stabilizes wall distribution and reduces scrap, which indirectly improves energy per good bottle. YuDa’s high-speed machines use a high-speed servo driving system integrated with a cam linking mechanism that combines mold opening, mold locking, and bottom mold elevation in one movement, reducing wasted motion.
Frequency conversion on auxiliary motors, and energy recovery on decelerating masses, further trims the transmission load. These measures are especially valuable on high-cavity machines where motion frequency is high and the summed motion energy is significant.
Operational Management and OEE Coupling
Equipment design sets the ceiling, but daily operation determines the result. The coupling between overall equipment effectiveness, or OEE, and specific energy is strong: a line that spends time idling, warming up, or making scrap consumes more energy per saleable bottle than a line that runs steadily at target rate.
Changeover Time and Warm-Up Loss
Every product change requires the oven to reheat and the settings to be re-validated, during which the machine consumes standby energy without producing good bottles. Modular, quick-change design shortens this window. YuDa’s modularized machine design supports convenient, cost-saving maintenance and changeovers, which directly reduces the non-productive energy between runs. Scheduling longer runs and minimizing unnecessary changeovers is a no-cost saving.
OEE and Specific Energy Coupling
Specific energy expressed as kWh per 1000 bottles falls as availability, performance, and quality rise, because the fixed loads of the oven and compressor are spread over more good bottles. A line running at 80 percent OEE will show a lower kWh per 1000 bottles than the same line at 60 percent OEE, even with identical machine settings. Therefore, maintenance discipline, operator training, and scrap reduction are energy projects in disguise. Demand scheduling to avoid peak utility periods, where the plant’s supply contract allows, further optimizes the cost side without changing the machine.
A practical habit is to plot specific energy as a daily trend, not just a monthly average. When the daily number climbs by more than a few index points without a product change, it is an early signal of lamp aging, leakage, or cooling shortfall, and it points the maintenance team to the right subsystem before the deviation grows. Linking this trend to the OEE loss tree also reveals whether a high specific energy comes from speed loss, availability loss, or quality loss, which dictates a completely different corrective action. Treating energy as a live production KPI, rather than a back-office invoice line, is what keeps a well-designed machine operating at its designed efficiency year after year.
Energy Baseline Reference by Output Tier
A baseline turns the general structure above into a number a plant can manage. The table below gives representative specific energy bands for reheat stretch blow molding lines by output tier, normalized to kWh per 1000 bottles. These are reference intervals, not guarantees; the actual value depends on bottle volume, gram weight, ambient condition, and how aggressively the saving methods have been applied. The key point is that higher-speed, better-optimized lines report lower specific energy because fixed overhead is spread over more bottles and the oven runs closer to its efficient design point.
| Output tier (BPH) | kWh per 1000 bottles (reference) | Installed power (kW) range | Dominant influencing factor |
|---|---|---|---|
| 1000 to 3000 | 60 to 110 | 20 to 45 | Higher idle and standby share at low speed |
| 3000 to 7000 | 45 to 80 | 40 to 90 | Balanced automatic line, moderate gram weight |
| 8000 to 15000 | 35 to 65 | 80 to 160 | Optimized oven and recovery at high speed |
When a line measures above its tier band, the first place to look is the oven and the compressed air system, because those dominate the total. A line sitting in the upper part of the band for its tier usually has recoverable losses such as aged lamps, leakage, or oversized blow pressure, all of which are addressed by the methods in this article.
Energy Saving Priority Matrix
Not all measures are equal. The matrix below ranks the main cost saving methods by power saving magnitude, implementation difficulty, relative investment grade, and expected payback window, so a plant can sequence projects for the fastest return. Relative investment is graded Low, Medium, or High, and the payback window is expressed in weeks or months rather than in currency.
| Measure | Power saving magnitude | Implementation difficulty | Relative investment | Payback window |
|---|---|---|---|---|
| Minimize heater distance to 38.1 mm | 30 percent plus of oven | Low | Low | Weeks |
| LED or short-wave infrared upgrade | Around 40 percent of oven | Medium | Medium | Months |
| High-pressure air recovery | 30 to 40 percent of air | Medium | Medium | Months |
| Blow pressure downscaling | 10 to 20 percent of compressor | Low | Low | Weeks |
| Leak detection and repair | 5 to 15 percent of air | Low | Low | Weeks |
| Servo stretch rod | Variable, motion-linked | Medium | Medium | Months |
| Preform lightweighting | Material and energy | Medium | Low | Weeks |
| Chiller and free cooling optimization | 5 to 10 percent of cooling | Medium | Medium | Months |
The logical sequence is to capture the Low-difficulty, Low-investment items first, because they deliver quick index point reductions and build the measurement discipline needed for the larger projects. Air recovery and lamp upgrades follow once the baseline is trustworthy, and lightweighting is pursued in parallel with the preform supplier since it touches raw material as well as energy.
YuDa FGX High-Speed Series
YuDa’s FGX high-speed series covers the 8000 to 15000 BPH range and is built for high-volume plants where every index point of energy matters. The series applies the 38.1 millimeter minimized heater distance and a high-speed servo driving system, and it is offered in multiple cavity configurations to match the required output.
| FGX configuration | Cavities | Output (BPH) | Bottle volume (L) | Heating lamps | Installed power (kW) | High-pressure (MPa) | Air use (m³/min) |
|---|---|---|---|---|---|---|---|
| FGX series, 4-cavity | 4 | 8000 to 9000 | 0.2 to 2.0 | 18 to 30 | 80 to 100 | 2.5 to 3.2 | 3.0 to 4.0 |
| FGX series, 6-cavity | 6 | 10000 to 12000 | 0.2 to 2.0 | 28 to 44 | 100 to 130 | 2.5 to 3.2 | 4.0 to 5.5 |
| FGX series, 8-cavity | 8 | 13000 to 15000 | 0.2 to 1.5 | 38 to 60 | 120 to 160 | 2.5 to 3.2 | 5.0 to 7.0 |
Single-mode speed on the FGX platform reaches 2500 to 3000 BPH per cavity, which is how an 8-cavity unit reaches the top of the 15000 BPH band. The minimized heater distance and optimized oven are standard across the series, so the energy per 1000 bottles stays low even at maximum output. Remote monitoring allows engineers at the YuDa headquarters to read PLC data and flag abnormal consumption to the customer site, turning energy management into a shared task.
YuDa Standard Speed Automatic Series
For plants in the 1000 to 7000 BPH range, YuDa’s standard speed full automatic series delivers the same energy-saving philosophy in a more compact footprint. It is suited to regional bottlers, edible oil packers, and daily chemical producers whose volume does not require high-speed cavities but who still need stable, efficient production.
| Standard series configuration | Cavities | Output (BPH) | Bottle volume (L) | Heating lamps | Installed power (kW) | High-pressure (MPa) | Air use (m³/min) |
|---|---|---|---|---|---|---|---|
| Standard series, 2-cavity | 2 | 1000 to 2000 | 0.2 to 3.0 | 10 to 18 | 20 to 35 | 2.5 to 3.2 | 1.0 to 2.0 |
| Standard series, 3-cavity | 3 | 2000 to 3500 | 0.2 to 2.0 | 14 to 24 | 35 to 55 | 2.5 to 3.2 | 1.5 to 3.0 |
| Standard series, 4-cavity | 4 | 4000 to 7000 | 0.2 to 2.0 | 18 to 30 | 55 to 90 | 2.5 to 3.2 | 2.5 to 4.0 |
YuDa also offers a semi-automatic series with lower procurement cost for small enterprises and a linear blowing-filling-capping combiblock that saves plant area by combining processes. Both benefit from the same modular maintenance approach that keeps energy and service cost predictable over the machine life.
Application Industries
YuDa PET blow molding equipment serves a broad set of industries, and the energy methods above apply across all of them because the underlying physics is the same:
- Drinking water: the largest volume application, typically 0.33 to 1.5 liter bottles where lightweighting and air recovery give the fastest return because of high unit counts.
- Carbonated beverages: require higher orientation and consistent base performance; pressure downscaling must be validated against burst and pressure retention.
- Edible oil: larger 1 to 5 liter bottles with hot-fill or ambient-fill requirements, where mold cooling and cycle time dominate the energy picture.
- Daily chemical: detergents, shampoos, and cleaners in varied shapes where preform design and stretch profile optimization protect wall distribution.
- Condiments and sauces: mid-volume lines that benefit from the standard speed series and modular changeovers between SKUs.
- Pharmaceutical and cosmetic: smaller, higher-specification containers where process stability and clean cooling water matter as much as raw energy.
The Wanplas group, as the parent brand of YuDa, supplies the broader packaging line context, so a beverage producer can plan blow, fill, and downstream equipment within one quality framework. YuDa’s own focus remains PET bottle blow molding machines, where its 20 plus patents and top-two China manufacturer status are concentrated.
Selection Guidance Table
Choosing the right YuDa series starts from the required output, bottle volume, material, and shift pattern. The table maps typical requirements to a recommended series, using the real FGX and standard speed configurations described above.
| Target output (BPH) | Bottle volume | Material | Shifts per day | Recommended YuDa series |
|---|---|---|---|---|
| 1000 to 2000 | 3 to 10 L | PET | 1 to 2 | Standard speed, 2-cavity |
| 2000 to 4000 | 0.2 to 2.0 L | PET | 2 | Standard speed, 3-cavity |
| 4000 to 7000 | 0.2 to 2.0 L | PET | 2 to 3 | Standard speed, 4-cavity |
| 8000 to 12000 | 0.2 to 2.0 L | PET | 3 | FGX series, 4 to 6-cavity |
| 12000 to 15000 | 0.2 to 1.5 L | PET | 3 | FGX series, 6 to 8-cavity |
For non-standard volumes or special resins, YuDa engineers review the preform drawing, target output, and local utility profile before recommending cavity count and oven configuration. This engineering-first approach avoids oversized machines that would idle and waste energy.
Service and Support
YuDa, as a Wanplas factory, backs its PET blow molding equipment with a service program designed to keep energy and operating cost predictable over the machine life:
- Testing before shipment: every machine is run and verified, including energy-relevant checks such as oven balance and air recovery function, before it leaves the factory.
- Installation and commissioning: engineers set the machine to the validated recipe so it starts at the intended kWh per 1000 bottles rather than at a default high-power setting.
- Spare parts policy: the Wanplas brand provides USD 500 free parts every year, covering wear items such as lamps, seals, and sensors that affect energy performance.
- Training: operators learn recipe management, lamp replacement scheduling, and leak inspection so the saving methods in this article are sustained on the floor.
- Remote operation and maintenance: the monitoring system lets YuDa engineers read PLC data and detect abnormal energy trends, then advise corrective action before efficiency drifts.
- Open factory visits: customers are welcome to visit the plant, observe machine testing, and review the energy features firsthand.
Measurement and Verification
No cost saving method should be claimed without measurement. A structured measurement and verification routine turns good intentions into documented results and prevents efficiency from silently decaying after the initial project.
Start with sub-metering: place energy meters on the oven, the high-pressure compressor, the servo drive, and the chiller so each load is visible. Record power across a full representative production cycle, including warm-up, steady running, and idle. Normalize the data to kWh per 1000 bottles at the actual output, which removes the effect of speed and gives a comparable baseline. Establish the baseline as 100 index points for the whole line, then track each improvement as a reduction in index points.
The ISO 50001 energy management framework, built on a plan-do-check-act loop, fits this process well. It asks the plant to set an energy policy, identify significant energy uses, act on the prioritized measures, and verify outcomes with data. Even without formal certification, adopting the discipline of baseline, target, action, and verification is what separates a one-time saving from a permanent one.
Common Energy Anomaly Diagnosis
When specific energy rises unexpectedly, the cause is usually one of a small set of recurring faults. Quick diagnosis avoids both wasted power and wasted troubleshooting time.
- Lamp failure or aging: a dim or aged lamp reduces oven output, prompting the controller to raise total power. Symptom: rising kWh per 1000 bottles with no recipe change. Action: measure lamp output and replace on schedule.
- Air path leakage: a leaking valve or fitting raises the leakage rate; if it exceeds 10 percent, the compressor runs extra hours. Symptom: compressor duty cycle climbs while bottle count is steady. Action: ultrasonic leak survey and repair.
- Inadequate cooling: fouled mold channels or warm cooling water extend cycle time, lowering BPH and raising energy per bottle. Symptom: longer cycle, warmer base. Action: clean channels, verify chiller and flow.
- Uneven preform preheat: poor rotation or reflector damage causes hot and cold sides, raising scrap. Symptom: wall distribution variation, higher reject rate. Action: inspect rotation and reflector, re-tune zones.
- Oversized blow pressure: pressure left at maximum by default wastes compressor energy. Symptom: stable bottles at far above needed pressure. Action: validate and downscale per bottle.
Frequently Asked Questions
What is the largest energy consumer in a PET blow molding line?
The heating oven with its infrared lamps is typically the largest electrical load, responsible for roughly 50 to 70 percent of total electricity consumption. Optimizing lamp layout, reflection, and preheat control gives the highest saving potential, and YuDa’s minimized 38.1 millimeter heater distance targets exactly this load.
How much electricity can high-pressure air recovery save?
A single-stage recovery system returns 30 to 40 percent of the high-pressure blow air back into the network, while multi-stage schemes can exceed 50 percent. Because compressed air generation is the second largest load, recovery directly reduces both air consumption and compressor running hours without changing bottle quality.
Can I run blow molding at lower pressure to save energy?
Yes, when bottle geometry and base design permit, blow pressure can be downscaled from 4.0 MPa toward 2.5 to 3.0 MPa. The decision depends on bottle volume, axial and radial stretch ratio, and base stiffness requirements, so each bottle must be validated before reducing set pressure to confirm top load and burst performance are maintained.
How does preform lightweighting reduce energy?
Reducing preform gram weight lowers the thermal mass that the oven must heat and reduces raw material per bottle. Lower gram weight means shorter residence in the oven and reduced cooling duty, so the same machine produces more bottles per kilowatt hour while also cutting PET consumption per unit.
What is the benefit of servo stretch rods over pneumatic stretch rods?
Servo-driven stretch rods use electrical energy only during motion and can recover energy on return strokes, whereas pneumatic rods consume compressed low-pressure air continuously. Servo control also improves stretch repeatability, which stabilizes wall distribution and reduces scrap, indirectly lowering energy per good bottle.
How often should infrared lamps be replaced?
Infrared lamps lose output gradually with aging rather than failing suddenly. A scheduled replacement interval based on running hours, combined with output measurement at the lamp, keeps oven efficiency stable. Running aged lamps longer forces the controller to raise power, increasing kWh per 1000 bottles and raising the energy baseline.
What leakage rate is considered high risk for compressed air?
A measured leakage rate above 10 percent of total compressed air generation is classified as high risk. At that level the compressor runs extra hours and the specific energy of the whole line rises, so a leak detection and repair program using ultrasonic survey should be treated as a priority action rather than occasional maintenance.
How do I establish an energy baseline for a blow molding line?
Install sub-metering on the oven, compressor, servo drive, and chiller, then record power over a full representative production cycle. Normalize the result to kWh per 1000 bottles at the actual output to create a baseline that later improvements can be measured against, following an ISO 50001 style plan-do-check-act loop for continuous verification.
Conclusion
Energy consumption of PET blow molding equipment is dominated by the heating oven and the high-pressure air system, with the remaining loads spread across pneumatics, servo transmission, cooling, and auxiliaries. The most effective cost saving methods attack these two dominant loads first: minimize heater distance and upgrade lamp technology for the oven, and recover and right-size high-pressure air for the compressor. Lightweighting, pressure downscaling, servo motion, and disciplined operation then compound the gain by lowering both thermal mass and non-productive energy.
YuDa Machinery, a Wanplas factory with more than 20 years of PET blow molding experience and equipment running in 60 plus countries, builds these principles into the FGX high-speed series from 8000 to 15000 BPH and the standard speed automatic series from 1000 to 7000 BPH. Whether you run drinking water, carbonated drinks, edible oil, daily chemical, or condiment lines, the path to lower specific energy follows the same engineering logic described here.
The sensible order of work is to measure first, then act on the largest loads: minimize heater distance and tune the oven, add high-pressure air recovery, downscale blow pressure where valid, lightweight the preform, and finally tighten operation and cooling. Each step is verified against the kWh per 1000 bottles baseline so the saving is documented rather than assumed. This sequenced approach delivers the steepest reduction in index points for the least relative investment and the shortest payback window.
If you are planning a new line or auditing an existing one, we invite you to share your bottle specification, target output, and shift pattern with our engineering team. We will review your preform drawing, recommend the right YuDa series and cavity configuration, and help you build a measured energy baseline so every improvement can be verified. You are also welcome to visit our factory to observe machine testing and discuss energy optimization face to face with our engineers.