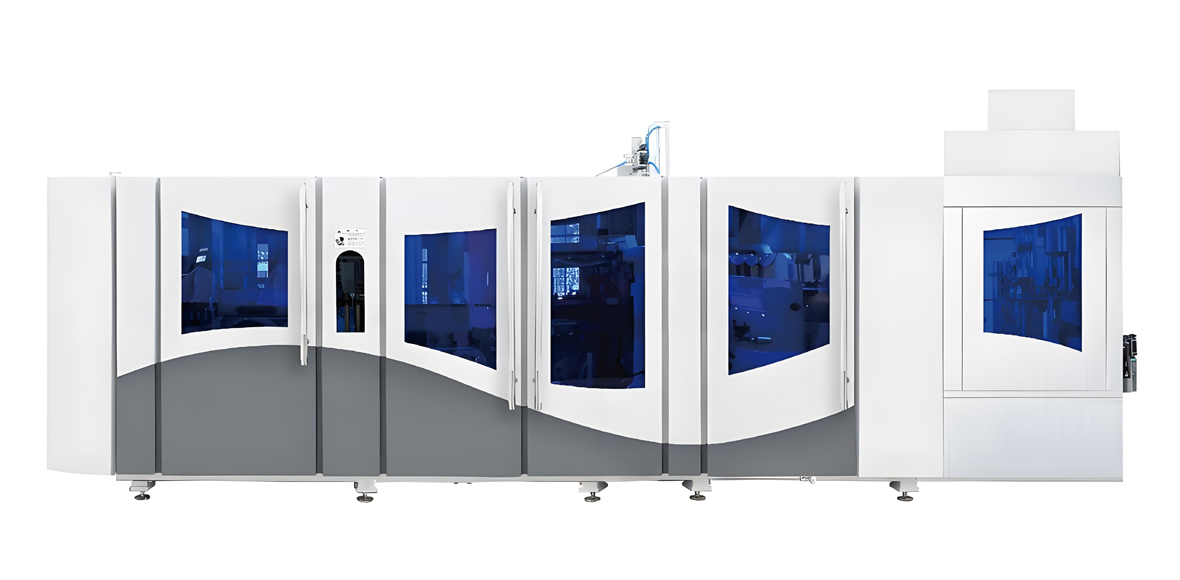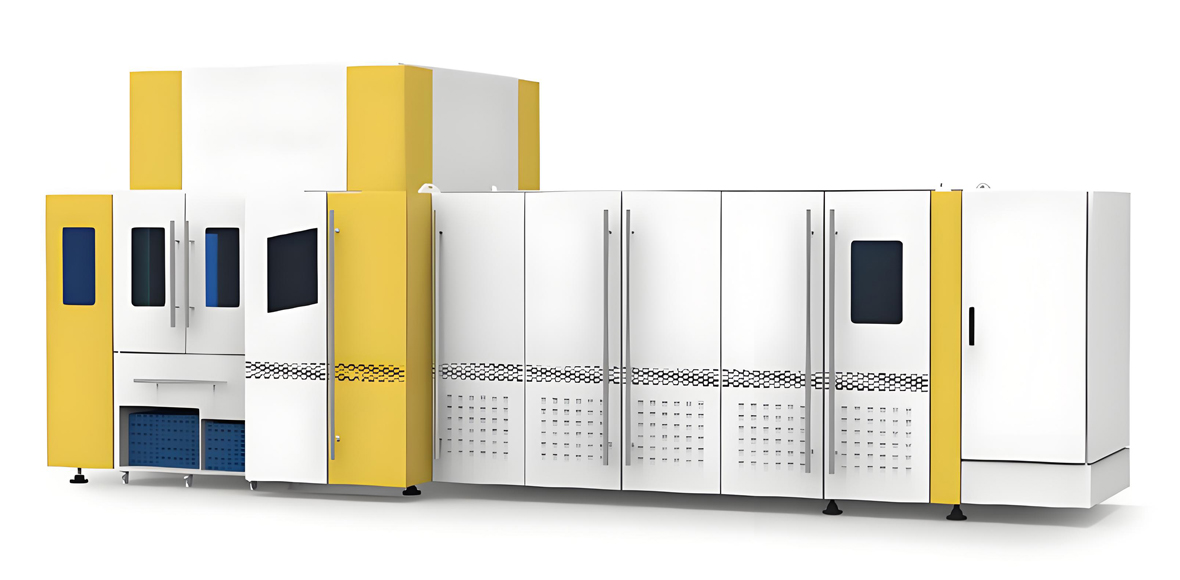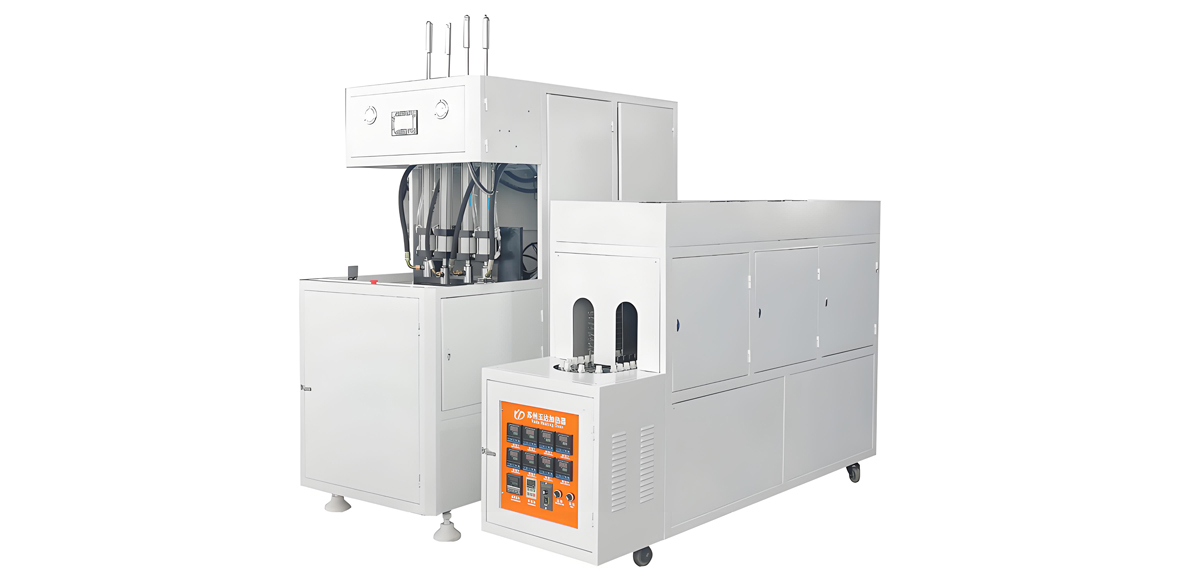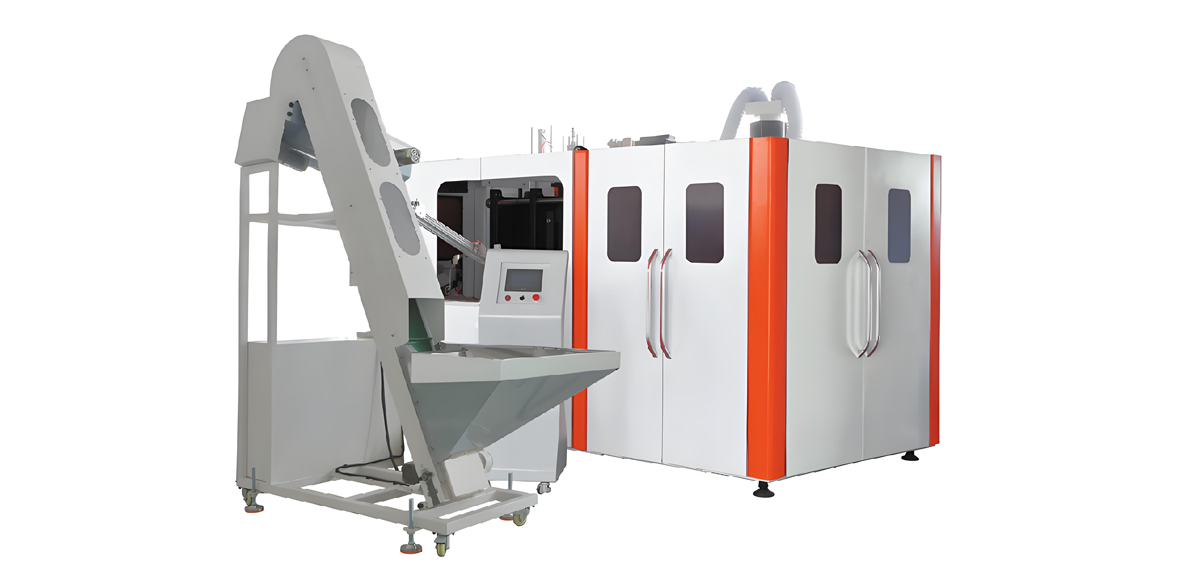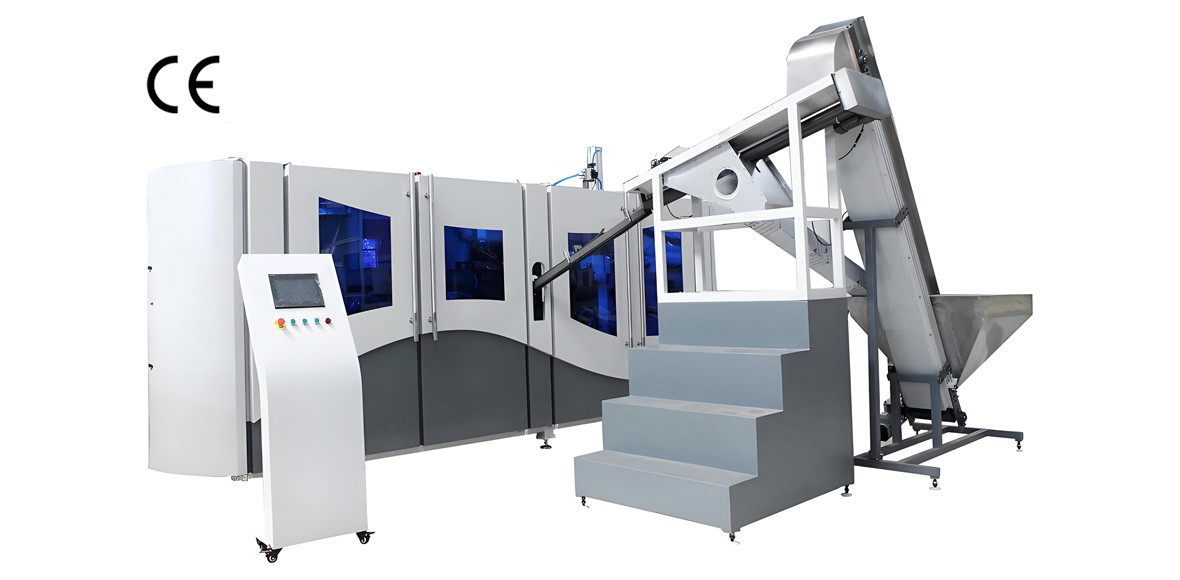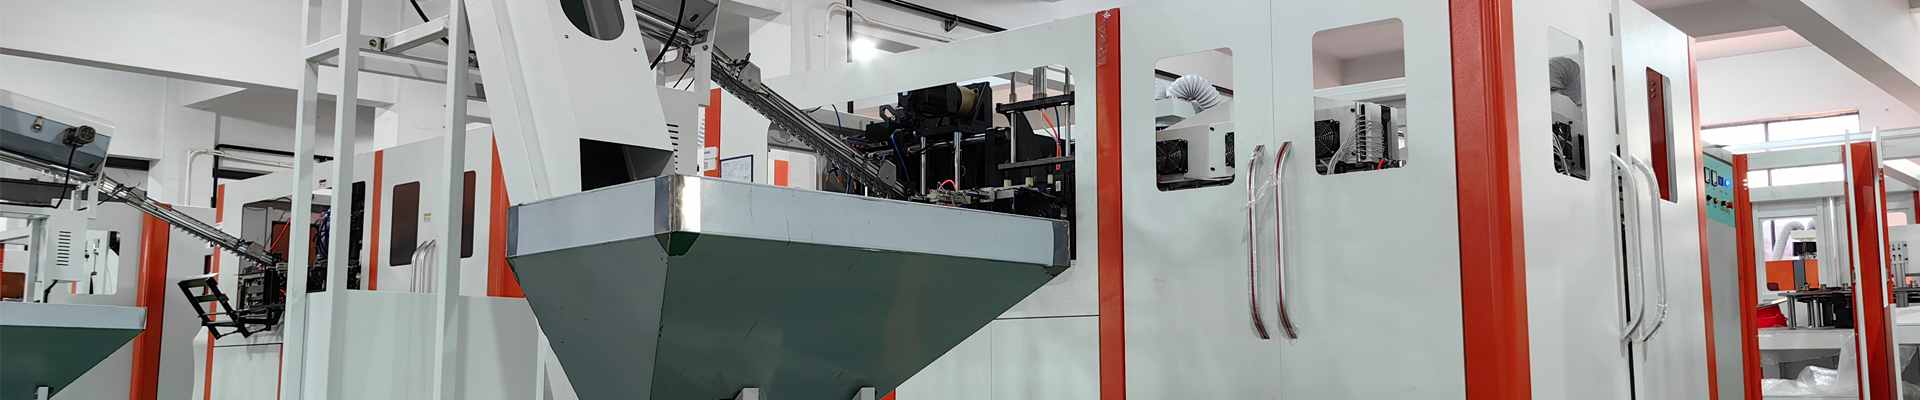
Depreciation and maintenance cost calculation of PET blowing machine equipment is the discipline that separates a bottle plant that quietly compounds margin from one that is surprised every year by its own cost sheet. YuDa Machinery, a Wanplas factory, has specialized in PET bottle blow molding machines for more than 20 years, exports to more than 60 countries, ranks among the top two PET bottle blow machine manufacturers in China, and holds more than 20 patents. Across those two decades the same question arrives from water bottlers, edible oil packers, beverage co-packers and cosmetic bottle producers: what does this machine really cost me over its whole life, not just on the day it arrives?
This guide answers that question without quoting a single price. Every figure below is expressed in one of four compliant forms: a relative cost tier (Low, Medium, High, Very High, Premium), an index normalized to a 100-point acquisition baseline, a percentage or ratio, or a physical quantity such as kWh per 1,000 bottles, labor hours per year, spare-parts count per year, or machine lifespan in years. That approach is deliberate. Machine prices vary by configuration, cavity count, voltage, freight route and local tax treatment, so any currency figure would be wrong for most readers within weeks. Index points, percentages and physical quantities remain valid everywhere and can be converted into local money by the reader in about five minutes with their own tariff and payroll data.
You will learn how to set a defensible useful-life assumption for a PET blow molding machine, how straight-line and activity-based depreciation produce very different annual charges for the same asset, how to break annual maintenance into spare parts, labor and energy, how the 38.1 mm heater pitch used by YuDa converts a design detail into a measurable reduction in energy index points, and how to assemble the whole picture into a Total Cost of Ownership index that a finance director and a maintenance manager can both sign. Two full specification tables cover the FGX high speed series and the standard speed series, and a selection table maps a production requirement directly to a recommended YuDa configuration and its cost tier.
Why Depreciation and Maintenance Cost Calculation Decides PET Bottle Profitability
Depreciation and maintenance are the two cost blocks a bottle producer controls for the longest period of time, and together they typically account for a Medium to High share of the non-resin cost of a PET bottle. Resin dominates the variable cost of a finished bottle, but resin cost is set by the market and by gram weight, while equipment cost is set by decisions the buyer makes once and then lives with for a decade or more. A machine chosen for the lowest acquisition tier can easily end its life in the highest total cost tier if it consumes more energy per 1,000 bottles, demands more spare parts per year, and idles more hours per year than a better-engineered alternative.
The mistake that recurs most often in PET bottle projects is treating acquisition as the whole cost. In a properly constructed ownership model, acquisition is only the entry ticket. Over a 10-year horizon at industrial duty, the cumulative energy, spare parts and maintenance labor attached to a PET blow molding line frequently exceed the acquisition figure itself. Expressed in index points against a 100-point acquisition baseline, a typical fully-automatic line running two shifts accumulates between 95 and 160 additional index points of running cost over 10 years, depending almost entirely on energy efficiency, utilization and maintenance discipline. That spread is wider than the spread between machine tiers on the day of purchase, which is exactly why the calculation matters.
There is a second reason the calculation matters: it is the only rational way to compare offers. A high speed line rated at 15,000 bottles per hour and a standard line rated at 4,000 bottles per hour cannot be compared on acquisition tier alone, because they do not deliver the same thing. Once depreciation is divided by annual good-bottle output, both machines produce a comparable metric — depreciation index points per million bottles — and the comparison becomes honest. The same conversion works for maintenance: spare-parts count per million bottles and maintenance labor hours per million bottles are directly comparable across machine classes and across plants in different countries.
Finally, depreciation is not merely an accounting exercise. The useful-life assumption drives the replacement calendar, the spare-parts stocking policy, the training plan and the insurance schedule. If a plant assumes 8 years and the machine actually runs 14, the plant will have expensed the asset long before it stops earning, and its unit costs in later years will look artificially attractive. If it assumes 15 years and the machine is retired at 9 because a product change made it obsolete, the plant carries a write-off it did not plan for. Getting the life assumption right, and revisiting it against real running hours, is the foundation of the entire model.
How Long Does a PET Blowing Machine Last? Useful Life and Lifespan Bands
A well-built PET blow molding machine has a mechanical service life of 10 to 15 years under normal industrial duty, and the useful life used for depreciation should sit inside that band rather than at either extreme. The frame, mold clamping unit and heating oven of a PET blow machine are not consumed the way a screw and barrel are consumed in an extruder; they wear slowly and predictably. What determines the end of life is usually a combination of accumulated cycle count, control-system obsolescence, and the point at which the product portfolio outgrows the machine’s cavity count or neck-finish range.
Useful life should be set by duty class rather than by a single default number. A semi-automatic machine running one shift on seasonal demand may still be serviceable after 15 years because it accumulates a fraction of the cycles a three-shift high speed line accumulates in the same calendar period. Conversely, a high speed line running three shifts on carbonated water can reach its economic replacement point at 10 years even though the frame is sound, because the servo drives, PLC generation and mold set have all moved on. The table below gives the lifespan bands YuDa engineers use when advising customers on depreciation assumptions.
Table 1 — Useful Life Bands and Annual Straight-Line Depreciation Rate
| Duty Class | Typical Shift Pattern | Annual Running Hours | Useful Life (years) | Straight-Line Rate per Year | Depreciation Cost Tier |
|---|---|---|---|---|---|
| Light duty semi-auto | 1 shift, seasonal | 1,600 to 2,200 | 14 to 15 | 6.7 to 7.1 percent | Low |
| Standard duty full-auto | 2 shifts | 4,000 to 5,000 | 12 to 13 | 7.7 to 8.3 percent | Medium |
| Heavy duty full-auto | 3 shifts | 6,000 to 7,000 | 10 to 12 | 8.3 to 10.0 percent | Medium to High |
| High speed continuous | 3 shifts plus weekends | 7,000 to 8,000 | 10 to 11 | 9.1 to 10.0 percent | High |
| Molds and tooling | All patterns | Cycle dependent | 3 to 6 | 16.7 to 33.3 percent | Medium |
| Air compressor and dryer | Follows line | Same as line | 8 to 12 | 8.3 to 12.5 percent | Medium |
| Control system refresh | All patterns | Not applicable | 7 to 10 | 10.0 to 14.3 percent | Low |
Notice that the asset is not one asset. Splitting the line into components with different lives — base machine, molds, air system, control system — produces a far more accurate annual charge than depreciating everything at one rate. Molds in particular deserve their own schedule. A blow mold set may be retired after 3 to 6 years not because it is worn but because the brand changed the bottle, and pretending it shares the 12-year life of the machine understates the annual cost of running a fashion-driven product line such as cosmetic bottles.
Component life is also strongly influenced by how the machine is treated in its first year. Preforms stored in humid conditions, compressed air delivered with oil carry-over, and heating lamps run above the recommended duty all shorten life quietly. YuDa specifies mature, stable component brands precisely because component-level reliability is what stretches a 10-year band toward its 15-year upper limit, and because a longer credible life spreads the acquisition baseline over more years and lowers the annual depreciation index for every bottle produced.
Depreciation Methods for PET Blowing Machine Equipment
Two depreciation methods matter for PET blowing machines: straight-line, which spreads the acquisition baseline evenly across the useful life in years, and activity-based (units-of-production), which spreads it across the total bottles the machine is expected to blow. Straight-line is simpler and is what most tax authorities expect; activity-based is more accurate for a plant with strongly variable demand, and it is the method that makes seasonal businesses such as bottled water look sane on paper.
Under straight-line, the annual charge is the acquisition baseline divided by the useful life, adjusted for residual value. With the acquisition baseline set at 100 index points, a 12-year life and a residual value of 10 percent, the depreciable amount is 90 index points and the annual charge is 7.5 index points per year. Change the life to 10 years and the annual charge rises to 9.0 index points; extend it to 15 years and it falls to 6.0 index points. That single assumption therefore moves the annual depreciation charge by 50 percent, which is why it must be defended with running-hour data rather than chosen for convenience.
Under activity-based depreciation, the same 90 depreciable index points are divided by the machine’s lifetime bottle capacity. A standard speed line at 4,000 bottles per hour running 5,000 hours per year for 12 years has a lifetime capacity near 240 million bottles, so each million bottles carries about 0.375 index points of depreciation. An FGX high speed line at 15,000 bottles per hour running 7,000 hours per year for 11 years has a lifetime capacity near 1,155 million bottles, so each million bottles carries only about 0.078 index points. That is the arithmetic behind the general rule that high speed equipment carries a High acquisition tier but a Low depreciation burden per bottle — provided the volume actually exists to fill it.
Table 2 — Straight-Line versus Activity-Based Depreciation Compared
| Criterion | Straight-Line Method | Activity-Based Method |
|---|---|---|
| Basis of allocation | Calendar years of useful life | Cumulative bottles blown |
| Annual charge, 12-year life, 10 percent residual | 7.5 index points, constant | Varies with output volume |
| Charge in a low-demand year | Unchanged, distorts unit cost upward | Falls with volume, keeps unit cost stable |
| Charge in a peak year | Unchanged, understates asset consumption | Rises with volume, matches real wear |
| Best suited to | Stable multi-shift production, tax reporting | Seasonal water and beverage, contract packing |
| Data required | Acquisition baseline, life, residual percent | Baseline, lifetime bottle capacity, counter data |
| Sensitivity to a wrong assumption | High, life assumption swings charge by 50 percent | Medium, self-corrects as counters accumulate |
| Administrative effort tier | Low | Medium |
A practical compromise used by many established bottle plants is to keep straight-line depreciation for statutory reporting and to run a parallel activity-based model for internal costing. The statutory book satisfies the auditor; the internal model tells the sales team what a million bottles genuinely costs to produce in a slow quarter. Because both models start from the same 100-point acquisition baseline, they reconcile easily and no currency conversion is ever required to compare a plant in one country with a plant in another.
A third variant, declining-balance depreciation, is sometimes applied where local tax rules encourage accelerated write-off. It front-loads the charge — for example 20 percent of the remaining balance per year — which reduces reported profit early and increases it later. For PET blow molding machines the physical wear pattern does not justify heavy front-loading, because these machines do not lose capability quickly in their first years. Declining-balance is therefore best treated as a tax instrument rather than as an engineering description of how the machine ages.
The 100-Point Acquisition Baseline: A Currency-Free Cost Index
The 100-point acquisition baseline is the anchor of the entire model: the delivered, installed and commissioned cost of a reference PET blow molding line is defined as exactly 100 index points, and every other cost in the machine’s life is expressed as a fraction of that anchor. This converts a procurement conversation that would otherwise be dominated by currency, exchange rates and freight terms into an engineering conversation about ratios that hold true in any market.
The reference asset for this article is a full-automatic PET bottle blow molding line of standard speed class, rated at 4,000 bottles per hour, installed with its air system, chiller and preform handling, operating two shifts at 5,000 hours per year, with a 12-year useful life and 10 percent residual value. That configuration is assigned 100 index points at acquisition. Any other configuration is then described as a multiple: a semi-auto machine sits in the 25 to 40 point range, a 6-cavity FGX high speed line sits in the 220 to 320 point range, and a blowing-filling-capping combination block sits higher still because it absorbs the filler and capper into one asset.
Three rules keep the index honest. First, the baseline always includes installation and commissioning, because a machine that arrives cheaply and needs three weeks of unbudgeted rework is not cheap. Second, the baseline includes the first mold set, since a blow machine without a mold produces nothing. Third, the baseline excludes building, utilities infrastructure and working capital, because those vary so widely by site that including them would destroy comparability between plants.
Table 3 — Acquisition Index Bands by Machine Class
| Machine Class | Output Range (BPH) | Acquisition Index (baseline 100) | Acquisition Cost Tier | Depreciation Index per Year (12-year, 10 percent residual) |
|---|---|---|---|---|
| Semi-auto single station | 800 to 1,500 | 25 to 40 | Low | 1.9 to 3.0 |
| Standard speed 2-cavity | 2,000 to 4,000 | 85 to 115 | Medium | 6.4 to 8.6 |
| Standard speed 4-cavity | 4,000 to 7,000 | 130 to 180 | Medium to High | 9.8 to 13.5 |
| FGX high speed 4-cavity | 8,000 to 10,000 | 190 to 250 | High | 14.3 to 18.8 |
| FGX high speed 6-cavity | 12,000 to 15,000 | 240 to 320 | Very High | 18.0 to 24.0 |
| Linear blowing-filling-capping block | 2,000 to 8,000 | 280 to 400 | Premium | 21.0 to 30.0 |
| Additional mold set | Not applicable | 4 to 12 | Low | 0.8 to 4.0 at 3 to 6 year life |
The most useful column in Table 3 is the last one, because it converts an acquisition tier into an annual charge. A Very High acquisition tier does not automatically mean a Very High cost per bottle. Divide 24.0 index points of annual depreciation by 100 million bottles per year and the result is small; divide 3.0 index points by 2 million bottles per year and the result is larger. The index framework makes that inversion visible immediately, which is precisely the insight a growing bottler needs before assuming the cheapest machine is the cheapest choice.
One caution on residual value. PET blow molding machines retain resale value better than many categories of plastics equipment because demand for used bottle capacity is broad and geographically distributed. A residual assumption of 8 to 15 percent of the acquisition baseline at the end of a 12-year life is realistic for a well-maintained machine with complete documentation, service records and an intact control system. Machines without service records or with obsolete, unsupported controls should be modeled at 0 to 5 percent, and that gap is a further quiet argument for disciplined maintenance recording.
Maintenance Component One: Spare Parts Consumption per Year
Spare-parts consumption on a PET blow molding machine is dominated by a short list of wear items, and it is best planned as a count of parts per year rather than as a lump sum. A well-run standard speed line consumes roughly 18 to 30 individual replacement items per year across all categories; a three-shift high speed line consumes 35 to 60. Counting parts instead of money produces a stocking list that a warehouse can act on and a figure that survives inflation.
The dominant categories are heating lamps, seals and gaskets in the high-pressure air circuit, valve components, filter elements, pneumatic actuators, bearings and guide elements in the clamping unit, and consumable electrical items such as sensors and proximity switches. Heating lamps deserve particular attention because they are consumed continuously, they directly affect preform temperature uniformity, and a lamp that has drifted in output raises scrap rate long before it fails completely.
Table 4 — Typical Annual Spare-Parts Count by Category
| Wear Item Category | Service Interval | Count per Year, Standard Speed (2 shifts) | Count per Year, FGX High Speed (3 shifts) | Relative Cost Tier | Consequence if Deferred |
|---|---|---|---|---|---|
| Infrared heating lamps | 6,000 to 9,000 hours | 6 to 10 | 12 to 20 | Medium | Uneven preform heating, higher scrap |
| High-pressure air seals and gaskets | 4,000 to 6,000 hours | 4 to 8 | 8 to 14 | Low | Air leakage, blow pressure loss |
| Blow valve components | Annual inspection | 2 to 4 | 4 to 8 | Medium | Inconsistent bottle wall distribution |
| Air and oil filter elements | 2,000 to 3,000 hours | 3 to 5 | 5 to 8 | Low | Contamination in air circuit |
| Pneumatic actuators | 3 to 5 years | 1 to 2 | 2 to 4 | Medium | Slow station movement, cycle drift |
| Bearings and guide elements | 4 to 6 years | 1 to 2 | 2 to 4 | Medium | Clamping misalignment, flash |
| Sensors and proximity switches | Condition based | 1 to 3 | 2 to 6 | Low | False stops, nuisance alarms |
| Mold surface refurbishment | 2 to 4 years | 0 to 1 event | 1 event | High | Surface marking on bottle body |
Expressed against the ownership index, annual spare-parts consumption on a well-maintained line typically falls between 1.5 and 3.5 index points per year for a standard speed machine and between 2.5 and 5.0 index points per year for a high speed line. Over a 12-year life that accumulates to roughly 18 to 42 index points — a material figure when the acquisition baseline is 100, and one that many buyers never model at all.
Two policies reduce that figure without reducing reliability. The first is condition-based replacement instead of calendar replacement for items that can be measured, such as lamp output and air-circuit leak rate; measuring avoids discarding serviceable parts. The second is standardization of the spare-parts list across machines in the same plant, which cuts the number of distinct items held in stock and raises the turn rate of the ones that remain. YuDa’s modular design philosophy supports both policies, because modules are shared across the standard speed and FGX families and a single stocked item often covers several machines.
Every Wanplas factory, including YuDa, also applies the group policy of USD 500 free parts per year, written here in letters as the reference form. In index terms that allowance offsets a meaningful slice of the routine wear list on a standard speed line, and it is best used for the high-frequency, low-tier items in Table 4 — seals, filter elements and sensors — where a small allowance covers a large part of the annual count.
Maintenance Component Two: Maintenance Labor Hours per Year
Maintenance labor on a PET blow molding line is best budgeted as hours per year rather than as a percentage of anything, because hours are what a maintenance manager actually schedules. A standard speed full-automatic line running two shifts requires approximately 180 to 260 maintenance labor hours per year; an FGX high speed line running three shifts requires approximately 320 to 450 hours per year. Those totals include planned preventive work, calibration, changeover support and a realistic allowance for corrective intervention.
The split between planned and unplanned work is the single most informative maintenance metric a plant can track. A mature operation runs at roughly 75 to 85 percent planned and 15 to 25 percent unplanned. A plant where unplanned work exceeds 40 percent of maintenance hours is not spending too much on maintenance; it is spending it in the most expensive possible way, because unplanned hours arrive during production and drag lost output behind them.
Table 5 — Annual Maintenance Labor Hours by Activity
| Activity | Frequency | Hours per Year, Standard Speed | Hours per Year, FGX High Speed | Skill Level | Labor Cost Tier |
|---|---|---|---|---|---|
| Daily inspection and cleaning | Every shift | 60 to 80 | 90 to 120 | Operator | Low |
| Weekly lubrication and checks | Weekly | 26 to 40 | 45 to 60 | Technician | Low |
| Monthly air-circuit leak survey | Monthly | 12 to 18 | 18 to 30 | Technician | Medium |
| Quarterly oven and lamp calibration | Quarterly | 16 to 24 | 28 to 40 | Technician | Medium |
| Semi-annual clamping unit service | Twice yearly | 16 to 24 | 30 to 44 | Engineer | High |
| Annual overhaul and alignment | Yearly | 24 to 36 | 45 to 70 | Engineer | High |
| Mold changeover support | Per changeover | 18 to 30 | 36 to 60 | Technician | Medium |
| Corrective and unplanned work | As required | 28 to 48 | 40 to 80 | Engineer | Very High |
Converting hours into index points requires the reader’s own payroll data, which is exactly the point: hours travel across borders, wage rates do not. As a planning rule, maintenance labor typically represents 1.0 to 2.5 index points per year against the 100-point acquisition baseline in a medium-wage manufacturing economy, and 2.5 to 5.0 index points in a high-wage economy. The physical hour count in Table 5 stays the same in both cases; only the conversion changes.
Two design features reduce the hour count directly. Modular construction shortens both changeovers and component replacement because a module is exchanged rather than rebuilt in place. Remote monitoring shortens diagnosis, which is usually the longest phase of any corrective intervention. YuDa’s remote monitoring system allows engineers at the China headquarters to inspect PLC data by mobile device and to feed abnormal-condition findings back to the customer site, which converts what would have been an on-site engineer visit into a guided local repair. For plants far from a service center, that single capability can remove 20 to 40 hours per year from the corrective column.
Maintenance Component Three: Energy per 1,000 Bottles
Energy is the largest recurring cost attached to a PET blow molding machine after resin, and it is measured most usefully as kWh per 1,000 bottles rather than as installed kilowatts. Installed power tells you what the electrician must provide; kWh per 1,000 bottles tells you what the accountant must pay. A conventional PET blow line consumes on the order of 7.0 kWh per 1,000 bottles for a 500 mL container, while a compact-pitch, high-cavity line can reach 4.1 to 4.8 kWh per 1,000 bottles for the same product.
Roughly 55 to 70 percent of the electrical load on a PET blow line is preform heating. The infrared oven must bring the preform body from ambient to the stretch-blow temperature window without overheating the neck finish, and any radiant energy that escapes to the oven walls instead of entering the preform is pure loss. This is where YuDa’s heater geometry earns its place in a cost model: the heater-to-preform distance is minimized to 38.1 mm, concentrating radiant energy on the preform and saving more than 30 percent of electricity compared with conventional heating ovens.
The second largest load is compressed air. Stretch blow molding requires high-pressure air, and the air system is where quiet waste accumulates: leaks in the distribution network, pressure set higher than the bottle actually needs, and air recovery systems that are installed but never commissioned. A leak survey performed monthly, listed in Table 5 at 12 to 30 hours per year, routinely recovers several percent of total line energy and is among the highest-return maintenance activities available.
Table 6 — Energy Consumption and Energy Index by Line Configuration
| Line Configuration | Heating Design | kWh per 1,000 Bottles (500 mL) | Annual kWh at 50 Million Bottles | Energy Index (baseline 100 at 7.0 kWh) | Energy Cost Tier |
|---|---|---|---|---|---|
| Older-generation full-auto | Wide lamp pitch oven | 7.0 to 7.6 | 350,000 to 380,000 | 100 to 109 | High |
| Standard speed 2-cavity | 38.1 mm compact pitch | 5.4 to 6.0 | 270,000 to 300,000 | 77 to 86 | Medium |
| Standard speed 4-cavity | 38.1 mm compact pitch | 5.0 to 5.5 | 250,000 to 275,000 | 71 to 79 | Medium |
| FGX high speed 4-cavity | 38.1 mm compact pitch | 4.6 to 4.9 | 230,000 to 245,000 | 66 to 70 | Low to Medium |
| FGX high speed 6-cavity | 38.1 mm compact pitch | 4.1 to 4.5 | 205,000 to 225,000 | 59 to 64 | Low |
| FGX with air recovery optimized | Compact pitch plus recovery | 3.8 to 4.1 | 190,000 to 205,000 | 54 to 59 | Low |
| Semi-auto two-step | Separate oven and blow station | 8.0 to 10.0 | Not typical at this volume | 114 to 143 | Very High per bottle |
Read the last row carefully, because it contains the most commonly missed point in PET equipment economics. A semi-auto machine has the lowest acquisition tier and the lowest annual depreciation charge, yet the highest energy consumption per bottle. For a producer making a few million bottles a year that trade is correct, since depreciation dominates at low volume. For a producer making 50 million bottles a year the trade inverts completely, and the energy penalty overwhelms the acquisition saving within the first years of operation.
To make the comparison concrete in physical units: a line producing 50 million bottles per year at 7.0 kWh per 1,000 bottles consumes 350,000 kWh annually, while the same volume at 4.3 kWh per 1,000 bottles consumes 215,000 kWh — a saving of 135,000 kWh every year, repeated for 10 to 12 years. Multiply by the plant’s own tariff to obtain a local figure; the physical saving itself needs no currency to be persuasive, and it is the reason energy efficiency belongs in the depreciation conversation rather than in a separate sustainability report.
YuDa FGX High Speed Series: Specifications and Cost-Tier Position
The FGX series is YuDa’s high speed PET bottle blow molding platform, engineered for producers whose bottleneck is bottles per hour rather than capital availability. It is built around a unique cam linking system that integrates mold-opening, mold-locking and bottom-mold elevation into a single synchronized movement, driven by a high-speed servo system, and it delivers a single-mold speed of 2,500 to 3,000 bottles per hour with line outputs from 8,000 to 15,000 bottles per hour depending on cavity count.
From a cost-calculation standpoint the FGX platform sits in the High to Very High acquisition tier and the Low depreciation-per-bottle tier. That combination is only advantageous when volume exists to fill it, which is why the selection table later in this article ties recommendations to annual bottle volume rather than to ambition. The specification table below gives the parameters a cost model actually needs: output, cavity count, rated power, air consumption, energy per 1,000 bottles, and the maintenance load in parts and hours.
Table 7 — FGX High Speed Series Specifications and Ownership Parameters
| Parameter | FGX 2-Cavity | FGX 4-Cavity | FGX 6-Cavity |
|---|---|---|---|
| Line output | 5,000 to 6,000 BPH | 8,000 to 10,000 BPH | 12,000 to 15,000 BPH |
| Single-mold speed | 2,500 to 3,000 BPH | 2,500 to 3,000 BPH | 2,500 to 3,000 BPH |
| Typical container volume | 100 mL to 2,000 mL | 100 mL to 2,000 mL | 200 mL to 1,500 mL |
| Heater pitch | 38.1 mm | 38.1 mm | 38.1 mm |
| Electricity saving versus conventional oven | More than 30 percent | More than 30 percent | More than 30 percent |
| Energy per 1,000 bottles (500 mL) | 5.0 to 5.4 kWh | 4.6 to 4.9 kWh | 4.1 to 4.5 kWh |
| Drive system | High-speed servo | High-speed servo | High-speed servo |
| Clamping mechanism | Cam linking, one movement | Cam linking, one movement | Cam linking, one movement |
| Remote monitoring | Included | Included | Included |
| Acquisition index (baseline 100) | 150 to 190 | 190 to 250 | 240 to 320 |
| Spare-parts count per year (3 shifts) | 26 to 40 | 32 to 50 | 35 to 60 |
| Maintenance labor hours per year | 260 to 340 | 300 to 400 | 320 to 450 |
| Useful life at 3 shifts | 11 to 12 years | 10 to 12 years | 10 to 11 years |
| Depreciation index per million bottles | 0.14 to 0.19 | 0.10 to 0.14 | 0.07 to 0.10 |
The last row of Table 7 is the punchline of the FGX case. As cavity count rises the acquisition index rises steeply, but the depreciation index per million bottles falls by roughly half between the 2-cavity and 6-cavity configurations. Energy per 1,000 bottles falls at the same time, because fixed heating and air loads are spread across more containers. Both curves point in the same direction, which is why high speed equipment becomes the low-cost option above a volume threshold rather than below it.
Cavity scaling also changes the risk profile of maintenance. A 6-cavity line that drifts out of calibration wastes six containers per defective cycle instead of one, so the value of the quarterly oven and lamp calibration listed in Table 5 rises with cavity count. The correct conclusion is not to avoid high cavity counts but to fund the calibration discipline that protects them, since the maintenance hours involved are a fraction of the scrap they prevent.
YuDa Standard Speed and Semi-Auto Series: Specifications
The standard speed full-automatic series covers 1,000 to 7,000 bottles per hour and is the workhorse class for regional water plants, edible oil packers and mid-volume beverage producers. It carries a Medium acquisition tier, a Medium depreciation charge and a Medium energy index, and for the majority of plants worldwide it delivers the lowest total cost of ownership because it matches real annual volume rather than theoretical peak demand.
The semi-auto series occupies a different role entirely. With a Low acquisition tier and ready-to-ship availability, it lets a small enterprise enter PET bottle production, validate a market, and build volume before committing to a full-automatic line. Its energy per bottle is the highest of the three families and its labor requirement per bottle is higher still, so it should be modeled honestly: excellent at low volume, expensive at high volume.
Table 8 — Standard Speed and Semi-Auto Series Specifications and Ownership Parameters
| Parameter | Semi-Auto | Standard Speed 2-Cavity | Standard Speed 4-Cavity | Standard Speed 6-Cavity |
|---|---|---|---|---|
| Line output | 800 to 1,500 BPH | 2,000 to 4,000 BPH | 4,000 to 6,000 BPH | 6,000 to 7,000 BPH |
| Automation level | Manual preform loading | Full automatic | Full automatic | Full automatic |
| Typical container volume | 100 mL to 5,000 mL | 100 mL to 2,000 mL | 100 mL to 2,000 mL | 200 mL to 1,500 mL |
| Heating system | Infrared oven | 38.1 mm compact pitch | 38.1 mm compact pitch | 38.1 mm compact pitch |
| Energy per 1,000 bottles (500 mL) | 8.0 to 10.0 kWh | 5.4 to 6.0 kWh | 5.0 to 5.5 kWh | 4.8 to 5.2 kWh |
| Operators required per shift | 2 to 3 | 1 | 1 | 1 to 2 |
| Acquisition index (baseline 100) | 25 to 40 | 85 to 115 | 130 to 180 | 160 to 200 |
| Spare-parts count per year | 8 to 15 | 18 to 26 | 22 to 30 | 26 to 36 |
| Maintenance labor hours per year | 90 to 140 | 180 to 230 | 200 to 260 | 230 to 300 |
| Useful life | 14 to 15 years | 12 to 13 years | 12 to 13 years | 11 to 13 years |
| Depreciation index per million bottles | 0.55 to 1.10 | 0.32 to 0.45 | 0.28 to 0.40 | 0.24 to 0.34 |
| Best fit annual volume | Up to 5 million bottles | 8 to 20 million | 18 to 35 million | 30 to 45 million |
Comparing Table 7 and Table 8 side by side gives the complete cost map. The depreciation index per million bottles falls from a range of 0.55 to 1.10 on semi-auto equipment, through 0.24 to 0.45 on standard speed equipment, down to 0.07 to 0.19 on the FGX family. Energy per 1,000 bottles falls along the same path, from 8.0 to 10.0 kWh down to 4.1 kWh. Both curves reward volume, and neither rewards buying capacity that will sit idle.
All three families share the design characteristics that shape their maintenance profile: modularized construction for convenient and cost-saving maintenance and changeovers, mature and stable component brands, and the remote monitoring capability that shortens diagnosis. Those shared features are why the maintenance hour counts in Tables 5, 7 and 8 scale with duty and cavity count rather than jumping discontinuously between families.
The Total Cost of Ownership Index Model
Total Cost of Ownership for a PET blowing machine is the sum of five index blocks measured against a 100-point acquisition baseline: depreciation, energy, spare parts, maintenance labor, and downtime penalty. Building the model as a transparent addition of index points lets a plant see instantly which block dominates and therefore where improvement effort belongs, and it does so without a single currency figure.
The build-up below uses the reference asset defined earlier — a standard speed full-automatic line, 4,000 bottles per hour, two shifts, 5,000 hours per year, 12-year life, 10 percent residual, roughly 20 million bottles per year — and then shows an FGX 6-cavity line at 15,000 bottles per hour, three shifts, 7,000 hours per year, 11-year life, roughly 100 million bottles per year. Both are expressed in the same index units so they can be compared directly.
Table 9 — Ten-Year Total Cost of Ownership Index Build-Up
| Cost Block | Standard Speed Reference, Index Points per Year | Standard Speed, 10-Year Total | FGX 6-Cavity, Index Points per Year | FGX 6-Cavity, 10-Year Total | Share of TCO Tier |
|---|---|---|---|---|---|
| Acquisition (baseline) | 100 at year zero | 100 | 280 at year zero | 280 | High |
| Depreciation charge recognized | 7.5 | 75 | 25.5 | 255 | High |
| Energy | 4.5 to 6.5 | 45 to 65 | 16 to 22 | 160 to 220 | Very High |
| Spare parts | 1.5 to 3.5 | 15 to 35 | 3.5 to 6.0 | 35 to 60 | Medium |
| Maintenance labor | 1.0 to 2.5 | 10 to 25 | 2.0 to 4.5 | 20 to 45 | Medium |
| Downtime penalty | 1.0 to 4.0 | 10 to 40 | 3.0 to 9.0 | 30 to 90 | Medium to High |
| Total running cost excluding acquisition | 8.0 to 16.5 | 80 to 165 | 24.5 to 41.5 | 245 to 415 | Very High |
| Annual output, million bottles | 20 | 200 | 100 | 1,000 | Not applicable |
| TCO index per million bottles | 0.78 to 1.21 | 0.90 to 1.33 | 0.50 to 0.67 | 0.53 to 0.70 | Low on FGX |
Three conclusions follow directly from Table 9. First, running cost over ten years is comparable to or larger than the acquisition baseline itself on both machine classes, which confirms that acquisition-only comparisons are structurally misleading. Second, energy is the largest single recurring block on both machines, which is why a 30 percent electricity saving from heater geometry is not a marketing detail but the most valuable line item in the table. Third, when normalized per million bottles the FGX line lands in a materially lower TCO band than the standard speed line, but only because the model assumes it is actually filled with 100 million bottles per year.
To use the model, a plant substitutes its own values in four places: annual running hours, real output including scrap, local electricity tariff for converting kWh, and local wage rate for converting maintenance hours. Everything else — the index ratios, the lifespan bands, the parts counts — transfers unchanged. This is what makes an index model portable across the more than 60 countries YuDa exports to, where tariffs and wages differ by an order of magnitude but engineering ratios do not.
OEE, Downtime and the Real Cost of Unplanned Stoppages
Overall Equipment Effectiveness closes the loop between maintenance spending and depreciation recovery, because a machine that is not running is still depreciating. OEE is the product of three percentages — Availability, Performance and Quality — and every point of OEE lost inflates the depreciation index carried by each good bottle produced. A line at 65 percent OEE carries roughly 31 percent more depreciation per good bottle than the same line at 85 percent OEE.
That relationship is worth restating because it is where maintenance budgets are won and lost. Cutting maintenance spending to save 1 index point per year is a poor trade if it costs 3 points of OEE, since the depreciation charge is fixed and simply gets divided across fewer bottles. Conversely, spending an extra 0.5 index points per year on calibration and condition monitoring is an excellent trade if it lifts Quality by two percentage points on a high-cavity line.
Table 10 — OEE Components, Failure Modes and Depreciation Impact
| OEE Component | Typical Before | Achievable Target | Dominant Loss Mode on PET Blow Lines | Maintenance Lever | Effect on Depreciation per Good Bottle |
|---|---|---|---|---|---|
| Availability | 80 to 84 percent | 90 to 93 percent | Unplanned stops, long changeovers | Modular changeover, planned maintenance ratio above 80 percent | Reduces by 8 to 12 percent |
| Performance | 86 to 90 percent | 94 to 96 percent | Reduced speed running, minor stops | Air-circuit leak survey, servo tuning | Reduces by 6 to 9 percent |
| Quality | 96 to 97.5 percent | 99 to 99.5 percent | Wall distribution defects, neck deformation | Lamp calibration, preform drying control | Reduces by 2 to 3 percent |
| Combined OEE | 66 to 74 percent | 84 to 89 percent | Compound of the three above | Integrated maintenance program | Reduces by 18 to 25 percent |
| Unplanned stop frequency | 6 to 12 per month | 2 to 4 per month | Air leaks, sensor faults, lamp failure | Condition-based replacement | Reduces downtime penalty block |
| Mean time to diagnose | 60 to 180 minutes | 20 to 60 minutes | Waiting for expert judgment | Remote monitoring of PLC data | Reduces corrective labor hours |
The downtime penalty block in Table 9 is the financial expression of the OEE table. It captures the depreciation, labor and overhead that continue to accrue while the machine is stopped, and it is deliberately expressed as a range because it depends on whether the plant is capacity-constrained. In a plant selling everything it can make, an hour of downtime is an hour of lost revenue and the penalty sits at the top of the range. In a plant with spare demand headroom, the same hour can be recovered later and the penalty sits at the bottom.
Remote monitoring deserves a specific mention in the OEE discussion because it attacks the mean-time-to-diagnose row directly. When engineers at the YuDa headquarters can inspect PLC data by mobile device and send an abnormality assessment back to the customer site, the diagnosis phase compresses from hours to minutes and the repair begins sooner. Over a year that capability typically converts several unplanned stops from half-shift events into short interventions, which moves Availability upward without any additional spare-parts consumption.
Preventive Maintenance Schedule and Annual Labor Allocation
A preventive maintenance schedule for a PET blowing machine should be written in intervals of running hours rather than calendar dates, because a machine running 7,000 hours per year reaches every wear threshold roughly three times faster than one running 2,200 hours. Converting the schedule to hours also makes the labor budget in Table 5 self-consistent with the parts counts in Table 4.
The schedule below is a general framework consistent with standard engineering practice for stretch blow molding equipment. Actual intervals must always be confirmed against the machine manual supplied with the specific configuration, and any work inside the clamping area or on electrical and high-pressure air systems must follow lockout and depressurization procedures before the technician begins.
Table 11 — Preventive Maintenance Schedule by Running Hours
| Interval | Task Group | Typical Duration | Parts Typically Consumed | Skill Level | Risk if Skipped |
|---|---|---|---|---|---|
| Every 8 hours | Visual check, mold face cleaning, reject bin check | 15 to 25 minutes | None | Operator | Surface marking, undetected scrap drift |
| Every 160 hours | Lubrication points, guide rail wipe, filter drain | 40 to 60 minutes | Lubricant | Technician | Accelerated guide wear |
| Every 700 hours | Air-circuit leak survey, pressure verification | 2 to 4 hours | Seals as found | Technician | Rising kWh per 1,000 bottles |
| Every 2,000 hours | Filter element change, valve inspection | 3 to 5 hours | Filter elements, valve kit | Technician | Contamination, inconsistent blow |
| Every 2,500 hours | Oven lamp output calibration, temperature profile check | 4 to 8 hours | Lamps as measured | Technician | Uneven wall distribution |
| Every 5,000 hours | Clamping unit service, alignment verification | 8 to 16 hours | Bearings, seals | Engineer | Flash, mold damage |
| Every 10,000 hours | Major overhaul, servo and drive assessment | 24 to 48 hours | Actuators, bearings, sensors | Engineer | Cumulative degradation, life shortening |
| Per mold change | Mold fit, bottom mold height, cooling connection | 1.5 to 4 hours | O-rings | Technician | Startup scrap, extended ramp |
Adding the hours in Table 11 across a year of operation reproduces the totals in Table 5 within a reasonable margin, which is the internal consistency check every maintenance budget should pass. If a plant’s scheduled hours are far below the sum of its intervals, the shortfall will appear later as unplanned work, and unplanned work is the most expensive hour on the site because it arrives with lost production attached.
One structural point about the schedule: the modular design used across YuDa machines allows several of these task groups to be executed as module exchange rather than in-place repair. A module removed to the workshop can be serviced while the line runs on a replacement, which converts downtime hours into workshop hours. For a three-shift plant, that conversion is often worth more than the labor hours themselves, because it protects the Availability component of OEE.
Sensitivity Analysis: Utilization, Lifespan and Residual Value
Three assumptions dominate every depreciation calculation for PET blowing machine equipment: capacity utilization, useful life in years, and residual value percentage. Testing each of them across a plausible range is the fastest way to discover whether a purchase decision is robust or whether it depends on an optimistic input.
Utilization is the most powerful of the three. Depreciation index points per year are fixed under straight-line accounting, so the depreciation carried by each bottle is inversely proportional to how many bottles the machine actually blows. Moving utilization from 55 percent to 85 percent on the same asset reduces depreciation per bottle by roughly 35 percent, without changing a single component. That is a larger improvement than most equipment upgrades deliver, and it is available at no acquisition cost.
Table 12 — Sensitivity of Depreciation Index per Million Bottles
| Scenario | Utilization | Useful Life | Residual Value | Annual Depreciation Index | Annual Output, Million Bottles | Depreciation Index per Million Bottles |
|---|---|---|---|---|---|---|
| Pessimistic | 55 percent | 10 years | 5 percent | 9.5 | 13.2 | 0.72 |
| Conservative | 65 percent | 11 years | 8 percent | 8.4 | 15.6 | 0.54 |
| Base case | 75 percent | 12 years | 10 percent | 7.5 | 18.0 | 0.42 |
| Optimized | 85 percent | 13 years | 12 percent | 6.8 | 20.4 | 0.33 |
| Best practice | 90 percent | 15 years | 15 percent | 5.7 | 21.6 | 0.26 |
| Spread, worst to best | 35 points | 5 years | 10 points | 3.8 points | 8.4 million | 2.8 times difference |
The bottom row is the headline: between the pessimistic and best-practice scenarios, the depreciation burden carried by each million bottles differs by a factor of about 2.8, on the same machine. No procurement negotiation delivers that magnitude of improvement. It comes from running the asset well, keeping it alive longer, and protecting its resale condition — three outcomes that maintenance discipline produces simultaneously.
Residual value is the assumption most often set to zero out of caution, and that caution has a cost: it inflates the annual charge and makes every project look weaker than it is. A more defensible approach is to set residual by evidence — complete service records, an intact and supported control system, and a documented overhaul history justify the upper end of the 8 to 15 percent band, while an undocumented machine justifies the lower end. Maintenance records are therefore not paperwork; they are the evidence base for a balance-sheet number.
Application Industries and Their Cost Profiles
Depreciation and maintenance profiles differ measurably between bottle markets, because each industry imposes a different duty cycle, changeover frequency and quality tolerance on the same machine. YuDa equipment serves drinking water, edible oil, beverage and cosmetic bottle producers, and each of those four applications loads the cost model differently.
Drinking water bottles are the highest-volume, lowest-changeover application. A water plant typically runs two or three standard bottle formats for years, which keeps mold amortization low and changeover labor minimal. Utilization is high and stable, so straight-line depreciation is appropriate and the depreciation index per million bottles lands at the low end. The dominant recurring block is energy, which makes the 38.1 mm heater pitch and its 30 percent electricity saving directly decisive. Water bottling is also the application where blowing-filling-capping integration is most attractive, because the bottle never leaves the sterile path between blowing and filling.
Edible oil bottles sit in the middle of the profile. Container volumes are larger, commonly 1,000 mL to 5,000 mL, so bottles per hour is lower for the same kilograms of PET processed and energy per 1,000 bottles is naturally higher. Wall thickness requirements are stricter because filled oil containers must resist deformation during stacking and transport, which raises the value of consistent preform heating and therefore of lamp calibration. Changeovers between pack sizes are more frequent than in water, so mold sets amortize over shorter periods and appear in the model at the higher end of the 3 to 6 year tooling life band.
Beverage bottles, including carbonated soft drinks and juices, impose the most demanding technical requirements. Carbonated containers need pressure-resistant base geometry, hot-fill juice containers need heat-set process control, and both push the machine toward tighter process windows. This raises Quality sensitivity within OEE and increases the return on condition-based maintenance. Beverage is also the most seasonal application, which is the classic case for running an activity-based depreciation model in parallel with the statutory straight-line book so that off-season unit costs are not distorted.
Cosmetic bottles invert the pattern entirely. Volumes per format are small, formats change frequently with brand refreshes, and appearance tolerance is the strictest of the four. Mold amortization becomes a leading cost block rather than a minor one, often reaching the top of the 16.7 to 33.3 percent annual tooling depreciation band, while machine depreciation per bottle is high because runs are short. For cosmetic producers the correct strategy is usually a standard speed or semi-auto machine with an efficient changeover procedure, not a high speed line that would sit idle between short campaigns.
Table 13 — Application Cost Profile Comparison
| Application | Typical Container Volume | Changeovers per Year | Utilization Pattern | Dominant Cost Block | Preferred Depreciation Method | Mold Amortization Tier |
|---|---|---|---|---|---|---|
| Drinking water | 330 mL to 2,000 mL | 4 to 12 | High and stable | Energy | Straight-line | Low |
| Edible oil | 1,000 mL to 5,000 mL | 12 to 24 | Steady with pack-size shifts | Energy and molds | Straight-line | Medium |
| Beverage, carbonated | 250 mL to 2,000 mL | 10 to 20 | Strongly seasonal | Energy and downtime | Activity-based | Medium |
| Beverage, hot-fill juice | 250 mL to 1,500 mL | 10 to 20 | Seasonal peaks | Quality losses | Activity-based | Medium to High |
| Cosmetic bottles | 30 mL to 500 mL | 30 to 80 | Short campaigns | Mold amortization and changeover | Activity-based | High |
| Household and daily chemical | 200 mL to 2,000 mL | 15 to 35 | Non-seasonal | Energy and labor | Straight-line | Medium |
The practical lesson from Table 13 is that the same machine can be a low-cost asset in one application and a high-cost asset in another, purely because of duty pattern. Before selecting a configuration, a buyer should identify which cost block will dominate their own profile and then optimize for that block specifically — energy for water, mold strategy for cosmetics, process stability for hot-fill beverage.
Selection Guide: Requirement to Model to Cost Tier
Selecting a PET blowing machine for the lowest lifetime cost is a matter of matching annual bottle volume to the machine class whose depreciation index per million bottles is lowest at that volume. The table below maps a production requirement directly to a recommended YuDa configuration, its acquisition tier, and the ownership characteristics that follow.
Table 14 — Requirement to Model Selection and Cost Tier Map
| Production Requirement | Annual Volume | Recommended YuDa Configuration | Acquisition Cost Tier | Energy Index | Maintenance Labor Hours per Year | Depreciation Index per Million Bottles |
|---|---|---|---|---|---|---|
| Market entry, cosmetic or specialty bottles | Up to 5 million | Semi-auto series | Low | 114 to 143 | 90 to 140 | 0.55 to 1.10 |
| Regional water plant, single format | 8 to 20 million | Standard speed 2-cavity full-auto | Medium | 77 to 86 | 180 to 230 | 0.32 to 0.45 |
| Edible oil packer, multiple pack sizes | 15 to 30 million | Standard speed 4-cavity full-auto | Medium to High | 71 to 79 | 200 to 260 | 0.28 to 0.40 |
| Growing beverage co-packer | 30 to 45 million | Standard speed 6-cavity full-auto | High | 69 to 76 | 230 to 300 | 0.24 to 0.34 |
| High-volume water or CSD line | 45 to 75 million | FGX high speed 4-cavity | High | 66 to 70 | 300 to 400 | 0.10 to 0.14 |
| Large bottler, three-shift continuous | 75 to 110 million | FGX high speed 6-cavity | Very High | 59 to 64 | 320 to 450 | 0.07 to 0.10 |
| Compact water plant, minimum floor area | 10 to 40 million | Linear blowing-filling-capping block | Premium | 62 to 72 | 280 to 380 | 0.30 to 0.55 including filling |
Three selection rules follow from the table. First, do not buy a class above your realistic volume band; idle high speed capacity carries the worst depreciation index of any configuration in this article. Second, when volume sits on a boundary, prefer the lower class with a scaling path — YuDa’s modular architecture allows cavity migration within a family so that a 2-cavity line can grow rather than being replaced. Third, count the floor area saving when evaluating the blowing-filling-capping block, since it absorbs a separate filler and capper into one asset and one depreciation schedule.
A final note on integration. Where a project also needs upstream or downstream capability beyond bottle blowing, Wanplas as the parent brand supplies matched equipment across the plastics value chain, so a bottle plant can source a coordinated package rather than assembling incompatible islands. Within the bottle blowing step itself, YuDa remains the specialist factory and the point of technical accountability.
Service, Warranty and Support That Lower Lifetime Cost
Service policy belongs in a depreciation and maintenance model because it directly changes two of its inputs: the spare-parts count a plant pays for, and the corrective labor hours it absorbs. As a Wanplas factory, YuDa applies the group service framework, and each element maps to a specific line in the cost tables above.
USD 500 free parts per year. The Wanplas group provides USD 500 of free spare parts annually, written here in letters as the reference form. Applied against the high-frequency, low-tier items in Table 4 — seals, filter elements, sensors and gaskets — this allowance covers a meaningful share of the routine annual count on a standard speed line and reduces the spare-parts index block accordingly.
Warranty replacement for damaged parts. Parts that fail within the warranty period are replaced free of charge, which removes the early-life failure risk that would otherwise inflate the corrective labor and parts blocks in the first year — precisely the year in which a new plant can least absorb surprises.
Machine inspection and testing before shipment. Every machine is tested at the factory before it leaves, so commissioning time on site is shorter and the ramp to stable production is faster. Shorter commissioning means the depreciation clock starts producing sooner, which improves the first-year utilization figure that Table 12 shows to be so influential.
Remote monitoring system. Engineers at the China headquarters can review PLC data by mobile device and feed abnormality findings back to the customer site. This attacks the mean-time-to-diagnose row in Table 10 and typically removes 20 to 40 corrective labor hours per year for plants located far from a service center.
Open factory policy. Customers are welcome to visit the factory, witness machine testing and audit build quality before shipment. For a buyer building a depreciation case, a factory audit is the cheapest form of due diligence available, because it validates the useful-life assumption before the assumption is written into a balance sheet.
Installation, commissioning and training. On-site installation and operator training convert a machine into a producing asset and, equally important, transfer the daily and weekly task groups from Table 11 to the plant’s own staff. Every hour of Table 5 work performed competently in-house is an hour that does not become an expensive corrective intervention later.
Group quality commitments. The Wanplas promises covering transportation, production capacity and quality standards act as a floor under the whole ownership model, because they protect the assumptions on which the depreciation schedule is built. Standards commonly referenced in PET bottle projects, including CE marking requirements and ISO quality management practice, remain the baseline for equipment documentation and food-contact compliance in the destination market.
Frequently Asked Questions
How many years should I depreciate a PET blowing machine over?
Use 10 to 15 years, selected by duty class rather than by default. A one-shift semi-auto machine justifies 14 to 15 years; a two-shift full-automatic line justifies 12 to 13 years; a three-shift high speed line justifies 10 to 11 years. Molds should be depreciated separately over 3 to 6 years because they are usually retired for product-change reasons long before they are worn out.
Is straight-line or activity-based depreciation better for a PET bottle plant?
Straight-line is simpler and is normally what statutory reporting expects, so most plants keep it as the official book. Activity-based depreciation is more accurate for seasonal businesses such as beverage and bottled water because it links the annual charge to bottles actually produced. The practical answer for many producers is to run both: straight-line for the auditor, activity-based internally for pricing and costing decisions.
What share of total ownership cost is maintenance on a PET blow molding machine?
Across a ten-year horizon, spare parts plus maintenance labor typically account for a Medium share of the ownership index — roughly 25 to 60 index points against a 100-point acquisition baseline for a standard speed line, and 55 to 105 points for a three-shift high speed line. Energy is usually larger than both combined, which is why energy efficiency deserves first place in any cost-reduction plan.
How much electricity does a PET blowing machine use per 1,000 bottles?
A conventional full-automatic line uses roughly 7.0 to 7.6 kWh per 1,000 bottles for a 500 mL container. A compact-pitch line reaches 4.6 to 6.0 kWh depending on cavity count, and an FGX 6-cavity configuration reaches 4.1 to 4.5 kWh. YuDa minimizes the heater-to-preform distance to 38.1 mm, which saves more than 30 percent of electricity compared with conventional heating ovens.
How many spare parts should I stock per year?
Plan on 18 to 30 individual replacement items per year for a standard speed line running two shifts, and 35 to 60 items for a high speed line running three shifts. The list is dominated by heating lamps, air-circuit seals, valve components and filter elements. Standardizing the list across machines in the same plant reduces the number of distinct items held and raises stock turn.
How many maintenance labor hours does a PET blow line need annually?
Budget 180 to 260 hours per year for a standard speed full-automatic line on two shifts and 320 to 450 hours for an FGX high speed line on three shifts. A healthy operation keeps 75 to 85 percent of those hours in planned work. When unplanned work exceeds 40 percent of maintenance hours, the plant is not overspending on maintenance — it is spending in the most expensive way possible.
Does a higher-priced high speed machine really cost less to own?
It depends entirely on volume. The FGX family carries a High to Very High acquisition tier but a depreciation index of only 0.07 to 0.14 per million bottles, versus 0.24 to 0.45 on standard speed equipment and 0.55 to 1.10 on semi-auto machines. Above roughly 45 million bottles per year the high speed line is usually the lower-cost owner; below that threshold it is not, because unused capacity still depreciates.
What residual value should I assume at end of life?
Assume 8 to 15 percent of the acquisition baseline for a well-maintained machine with complete service records and a supported control system, and 0 to 5 percent for an undocumented machine or one with obsolete controls. Because residual value directly reduces the depreciable amount, disciplined maintenance recording has a measurable effect on the annual depreciation charge, not merely on resale day.
Conclusion
Depreciation and maintenance cost calculation of PET blowing machine equipment becomes straightforward once currency is removed from the analysis. Set the delivered and commissioned line at 100 index points, choose a useful life of 10 to 15 years by duty class, apply straight-line or activity-based depreciation according to how stable demand is, and then add the three recurring blocks measured in their natural physical units: spare-parts count per year, maintenance labor hours per year, and kWh per 1,000 bottles. The resulting Total Cost of Ownership index is comparable across configurations, across plants and across countries, and it converts to local money in minutes whenever a finance team needs it to.
The numbers in this guide point consistently in one direction. Running cost over ten years is comparable to or larger than the acquisition baseline. Energy is the single largest recurring block, so a design that saves more than 30 percent of electricity through a 38.1 mm heater pitch changes the total more than any negotiation on the purchase order. Utilization, useful life and residual value together swing depreciation per million bottles by a factor of nearly three on the same machine. And maintenance discipline is not a cost center but the mechanism that protects all three of those variables at once.
YuDa Machinery, a Wanplas factory with more than 20 years of specialization in PET bottle blow molding machines, exports to more than 60 countries, holds more than 20 patents, and ranks among the top two PET bottle blow machine manufacturers in China. Its FGX high speed series covers 8,000 to 15,000 bottles per hour, its standard speed full-automatic series covers 1,000 to 7,000 bottles per hour, and its semi-auto series gives smaller producers a low-tier entry point. All three families share modular construction for lower maintenance and changeover cost, mature and stable components, remote monitoring for faster diagnosis, and the group service framework including USD 500 free parts per year, warranty replacement, factory testing before shipment, and an open factory policy for customer audits.
If you are preparing a depreciation schedule or a maintenance budget for a new or replacement PET bottle line, send your target bottle format, gram weight, annual volume, shift pattern and electricity conditions to the YuDa engineering team. You will receive a tailored configuration proposal with the specification set, the expected energy per 1,000 bottles, the annual spare-parts count and the maintenance labor hours for that exact configuration, so your ownership model rests on parameters for the machine you will actually run rather than on generic assumptions. Requests for a factory audit or a sample trial run on your own preform are equally welcome.