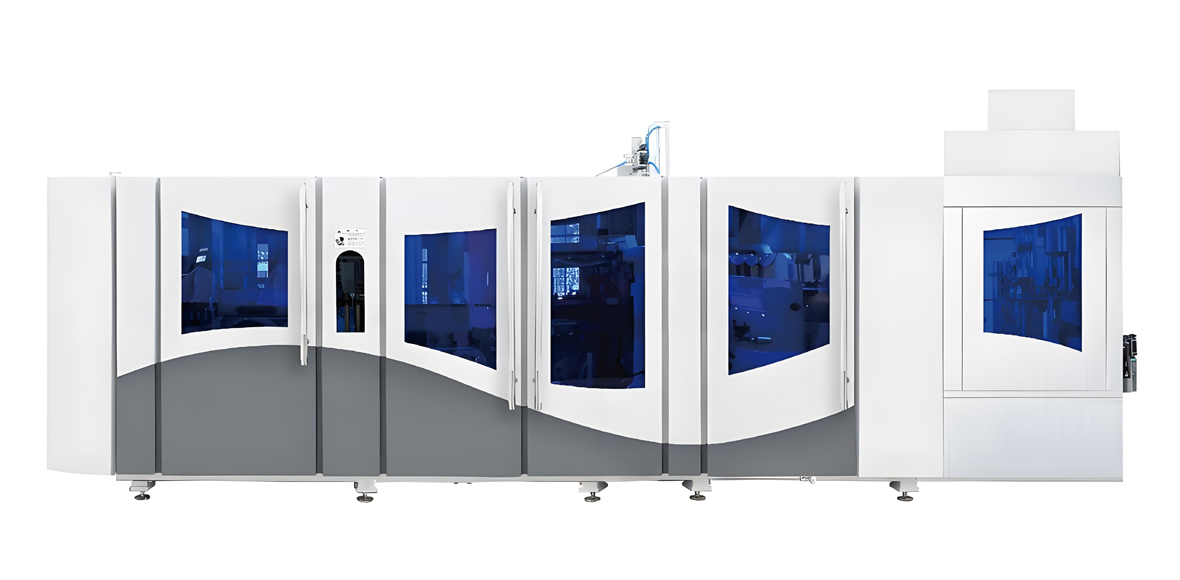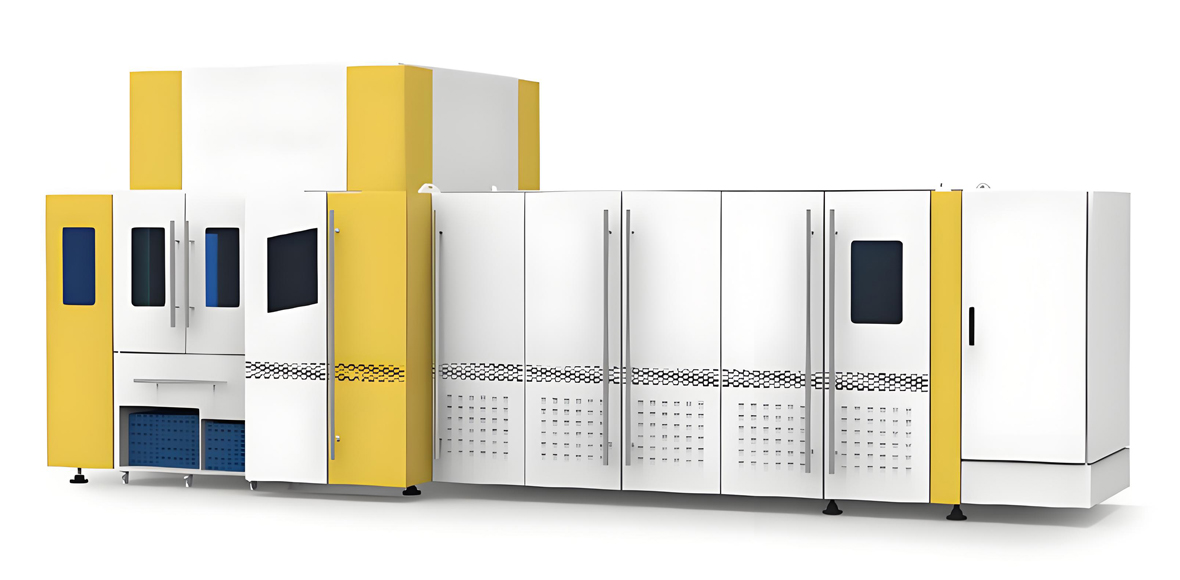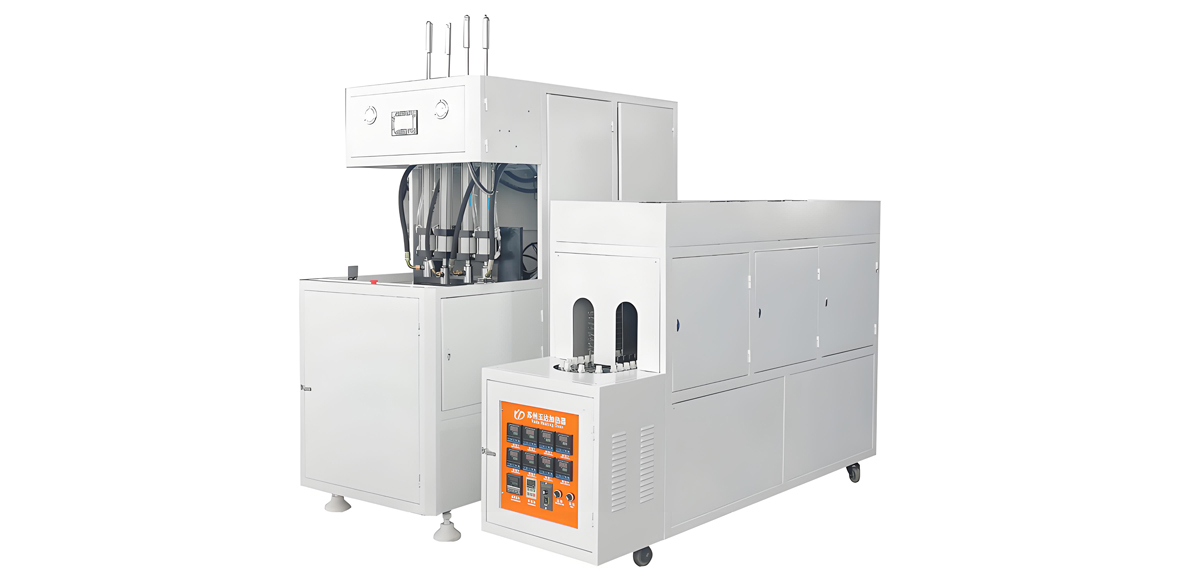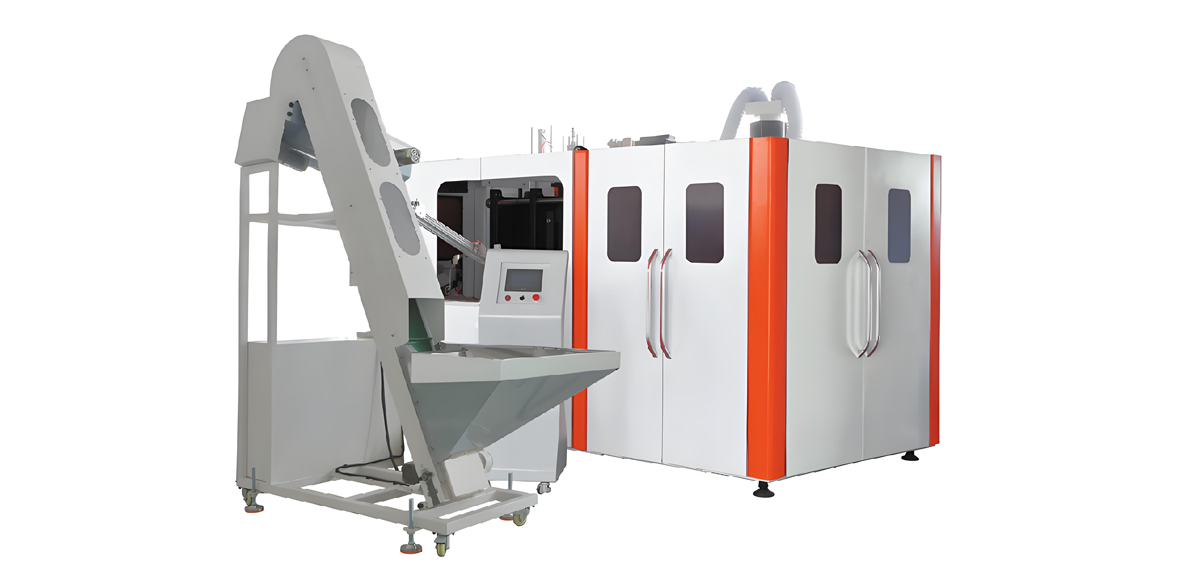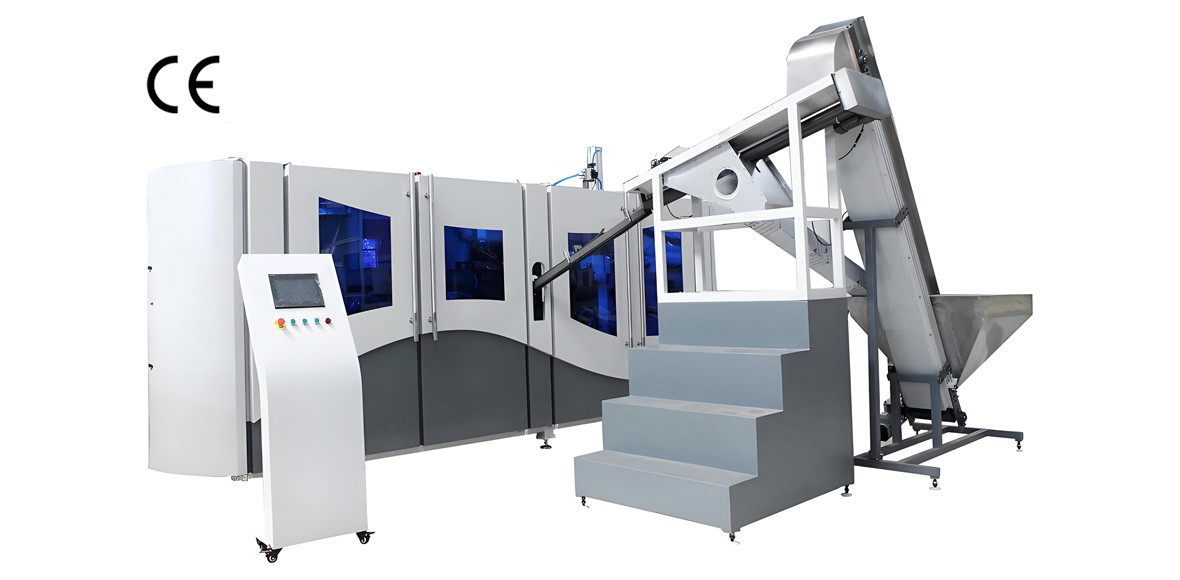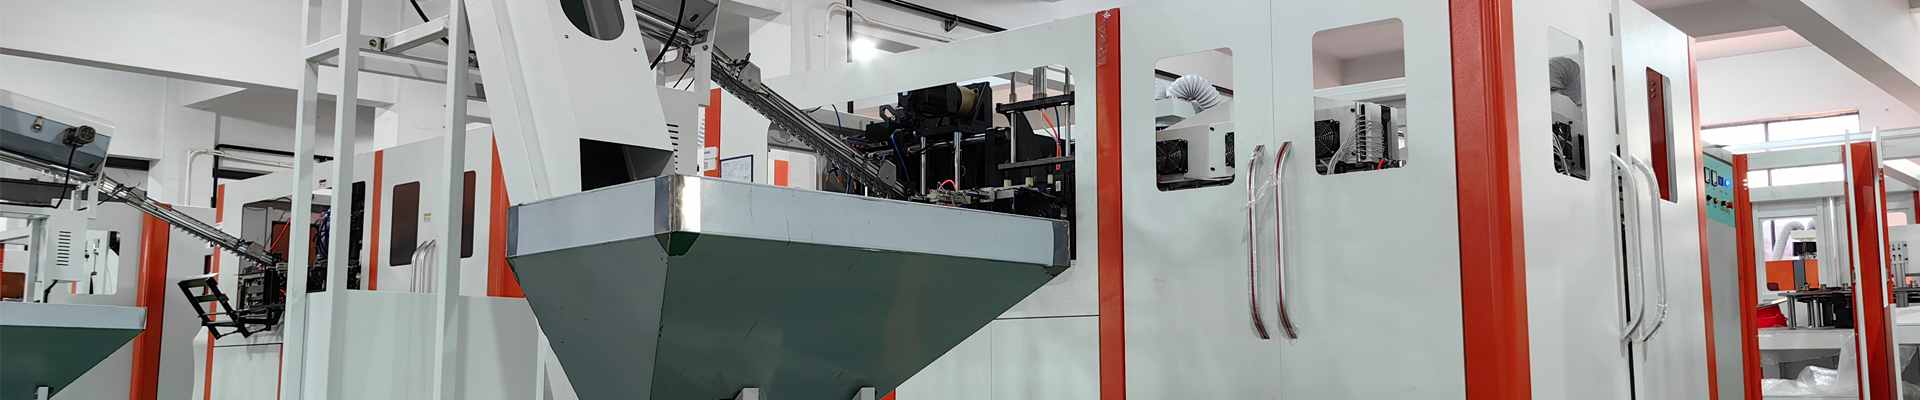
Choosing between new and old PET bottle blowing production equipment is rarely a simple purchase price decision, and treating it as one is the most expensive mistake a bottler can make. The headline acquisition number of a used machine can look attractive next to a brand new line, yet the operating reality of a legacy blow molder is defined by older quartz heating ovens, hydraulic motion, higher scrap, longer changeovers and a rising probability that a discontinued controller or valve will stop the line without warning. A new generation machine costs more to acquire but reshapes the cost base through near infrared heating, servo driven motion, high pressure air recovery and fast changeover tooling. For any plant running two or more shifts, the gap between the two options narrows or reverses once energy, scrap, maintenance and downtime are counted over the equipment life.
This guide builds a like for like cost comparison of new and old PET bottle blowing production equipment using an indexed method rather than absolute prices, because absolute acquisition figures vary by region, configuration, currency and negotiation to a degree that obscures the engineering truth. By setting a new generation automatic linear machine at a procurement index of 100 and scoring every alternative against it, the article makes the trade off visible: where the old machine saves on capital, it usually spends more on power, scrap and risk. The analysis covers equipment classification, ten evaluation dimensions, energy consumption in quantified terms, preform and bottle parameters, yield and scrap multiplication, overall equipment effectiveness, maintenance and end of life risk, lightweighting and recycled content capability, compliance and market access, a buyer decision matrix, the refurbished middle option, total cost of ownership and a consolidated cost index table.
YuDa, a Wanplas factory, has supplied PET bottle blow molding machines to more than sixty countries across more than twenty years, with a product range spanning the FGX high speed series rated up to fifteen thousand bottles per hour, standard speed full automatic machines from one thousand to seven thousand bottles per hour, semi automatic machines for smaller operations, and linear blowing filling capping CombiBlock systems that cut the number of validated interfaces in a new plant. YuDa machines apply a heater pitch reduced to 38.1 millimetres, which lowers oven electricity use by more than 30 percent against conventional heating, together with remote monitoring, modular tooling and servo driven motion. As of 2026, with energy pricing, recycled content mandates and food contact audit expectations all rising, the new versus old equipment decision has shifted decisively toward lifecycle cost rather than sticker price. The Wanplas brand, with its network of specialised factories, frames this comparison within a broader portfolio that also includes recycling and extrusion capability for customers integrating upstream material control.
Why the New vs Old PET Bottle Blowing Equipment Decision Defines Your Unit Cost
The unit cost of a PET bottle is the sum of resin, energy, labour, consumables, depreciation and the cost of every bottle that fails and must be remade. Equipment age changes almost all of those terms at once. A new machine lowers the energy term through efficient heating and servo drives, lowers the scrap term through stable process control, lowers the labour term through automation, and lowers the depreciation and risk terms through warranty and available spare parts. An old machine appears to lower only the first capital term, while quietly raising every operating term behind it.
The second reason the decision is decisive is that bottling is a high volume, low margin business where small per bottle differences compound. At volumes of tens of millions of bottles per year, a saving or penalty of even a fraction of a percent on energy or scrap translates into a large annual amount. This is precisely why a used machine that looks cheap on the purchase order can become the more expensive choice within the first operating year once the energy and scrap differences are booked.
The third reason is risk. A legacy machine carries an end of life exposure that a new machine does not: controllers, drives, heaters and valves that the original supplier no longer makes, and a rising chance of an unplanned stop that lasts days rather than hours. In a continuous beverage operation, downtime is the single largest uncontrolled cost, and it rises steeply with machine age. The cost comparison therefore has to include the probability and duration of failure, not only the steady state running numbers.
A useful discipline is to refuse to compare machines on acquisition price alone and instead to score every candidate on the same ten dimensions this article uses, expressed as relative cost levels, percentages and indices. That approach removes the illusion created by a low purchase number and shows the total picture an operations director actually lives with for the next decade.
PET Bottle Blowing Equipment Types and Capacity Tiers
PET bottle blowing equipment divides first into process architecture, then into automation style and finally into capacity tier. The process architecture is the one step and two step split. One step machines, properly called injection stretch blow molding, perform injection, conditioning and blowing in a single integrated station and are strong where handling and contamination must be minimised. Two step machines, called reheat stretch blow molding, separate preform injection from blowing, which gives far greater flexibility in preform sourcing, storage and blow mould changeover and dominates volume beverage production.
Within two step reheat stretch blow molding the automation style matters for cost. Linear machines move preforms through a line of blowing stations and suit small to medium volumes with frequent changeovers. Rotary machines spin preforms around a rotating carouse and reach very high output with excellent efficiency at scale. Semi automatic machines require an operator to load preforms and unload bottles and are the lowest capital entry, but their per bottle labour and energy cost is high. The capacity tiers run from roughly 1200 to 2400 bottles per hour per cavity on linear and rotary reheat lines, while rotary high speed lines reach 40000 to 90000 bottles per hour in aggregate.
Equipment Classification and Capacity Overview
| Architecture | Automation Style | Typical Output Range | Relative Acquisition Level | Best Fit |
|---|---|---|---|---|
| One step (injection stretch blow molding) | Integrated single station | Up to a few thousand bottles per hour | Medium to High | Pharma, cosmetic, low contamination need |
| Two step (reheat stretch blow molding) | Linear automatic | 1200–2400 bottles per hour per cavity | Medium to High | Regional fillers, mixed SKUs |
| Two step (reheat stretch blow molding) | Rotary high speed | 40000–90000 bottles per hour | High to Premium | Large beverage groups, CSD, water |
| Two step (reheat stretch blow molding) | Semi automatic | Hundreds to low thousands bottles per hour | Low to Medium | Startup, pilot, intermittent volume |
The relevance to cost is direct. A rotary high speed line carries the highest acquisition level but the lowest per bottle cost at scale because its energy per bottle and labour per bottle are minimised. A semi automatic machine carries the lowest acquisition level but the highest per bottle operating cost, so it only wins where volume is too low to justify automation. The new versus old comparison must always be made within the same architecture and automation class, because comparing a legacy semi automatic with a new rotary line is not a fair test of either.
New vs Used Equipment: Ten Evaluation Dimensions
A fair cost comparison needs a fixed list of dimensions, because buyers naturally anchor on the one dimension where the used machine looks best, which is acquisition price. The ten dimensions below cover the full lifecycle. Each is scored as a relative cost level from Low to Premium for a new machine and for a used or legacy machine of the same class, so the trade off is explicit rather than implied.
Ten Dimension Evaluation Matrix
| Evaluation Dimension | New Generation Machine | Used or Legacy Machine |
|---|---|---|
| Acquisition cost | High to Premium (index 100) | Low to Medium (index 25–60) |
| Installation and commissioning | Medium, predictable | Medium to High, uncertain utilities |
| Energy consumption | Low to Medium | High to Very High |
| Capacity utilisation (OEE) | High (85–92 percent) | Medium (65–80 percent) |
| Spare parts availability | High | Low to Medium, EOL risk |
| Control system generation | Latest, IoT and remote ready | Legacy, possibly obsolete |
| Mold compatibility | Full current neck and finish | Limited older neck and finish |
| Compliance and certification | Full current CE, food contact | Partial, needs re validation |
| Residual value after five years | Medium to High (45–55 percent) | Low (10–20 percent) |
| Downtime risk | Low | High, EOL components |
The pattern is consistent: the used machine is cheaper on exactly one line, acquisition cost, and equal or worse on the other nine. The real question is whether the single advantage on the capital line outweighs the accumulated disadvantages on the operating lines. For a plant running a single shift at modest volume, it sometimes does. For a plant running multiple shifts at high volume, it almost never does, because the operating disadvantages compound across hundreds of millions of bottles per year.
The matrix also exposes a common blind spot. Buyers score acquisition, energy and perhaps scrap, but forget control generation, mold compatibility, compliance and residual value. Control generation decides whether the machine can be monitored and integrated, mold compatibility decides whether it can make the bottles the market now wants, compliance decides whether it can legally sell into the target markets, and residual value decides how much capital returns at replacement. All four favour the new machine and all four are easy to omit from a naive spreadsheet.
Energy Consumption: The Decisive Operating Cost Factor
Energy is the largest and most quantifiable operating difference between new and old PET bottle blowing production equipment, and it is the dimension where the old machine’s penalty is hardest to argue away. Two technologies dominate the gap: the heating oven and the drive system. Legacy machines heat preforms with quartz lamp ovens that radiate broadly and waste a large share of input energy as heat lost to the surroundings. New machines use near infrared or efficient infrared heating with tighter wavelength match to PET absorption, smaller heater pitch and better reflection, cutting the energy actually needed to raise the preform to blowing temperature.
Heating Technology and Unit Energy Comparison
| Energy Element | Legacy Machine | New Generation Machine | Improvement |
|---|---|---|---|
| Unit energy, kilowatt hours per 1000 bottles | 0.22–0.35 | 0.12–0.18 | 35–55 percent lower |
| Oven heating principle | Quartz lamp, broad spectrum | Near infrared or efficient infrared | Tighter absorption match |
| Motion drive | Hydraulic | Servo electric | 25–40 percent less drive energy |
| High pressure air | Single stage 40 bar, no recovery | Staged 10–16 bar preblow plus 40 bar, recovery | 30–50 percent air recovered |
| Heater pitch | Conventional, larger spacing | Compact pitch such as 38.1 millimetres | 30 percent plus oven electricity saving |
Three mechanisms combine. First, near infrared heating lowers the unit energy from 0.22 to 0.35 kilowatt hours per thousand bottles down to 0.12 to 0.18, a reduction of 35 to 55 percent. Second, replacing hydraulic motion with servo electric motion saves 25 to 40 percent of the drive energy that hydraulic pumps consume even while idle. Third, a high pressure air recovery system captures 30 to 50 percent of the blowing air that would otherwise be vented and reuses it for the next cycle, while staged compression that preblows at 10 to 16 bar before the 40 bar finishing pressure reduces the load on the most expensive compressor stage.
Why this dominates the comparison is scale. Energy is consumed on every single bottle, every shift, every day, for the whole life of the machine. A 40 percent reduction in unit energy is not a one time saving; it is a permanent downward shift in the largest recurring line of the operating budget. At high annual volume, the cumulative energy saving alone frequently exceeds the extra acquisition premium of the new machine within a payback window of roughly 18 to 30 months, after which the new machine keeps paying the difference as pure margin.
The old machine’s energy penalty is also growing structurally. As electricity intensity in the cost base rises and as energy management standards such as ISO 50001 become procurement or audit requirements for large beverage buyers, a legacy line with no recovery and broad spectrum heating becomes not just costly but difficult to defend in a sustainability report. Newer equipment with documented energy per thousand bottles is far easier to place into a verified energy reduction programme.
Preform and Bottle Technical Parameters That Drive Cost
The cost of a bottle is written first in the preform and bottle specification, because that specification sets how much resin is used, how much energy is needed to heat and stretch it, and how forgiving the process is. PET intrinsic viscosity, neck crystallisation, stretch ratio and conditioning temperature are the parameters that decide whether a machine runs cheaply or expensively, and they differ by application.
Preform and Bottle Parameter Bands by Application
| Parameter | Still Water | Carbonated Soft Drink | Hot Fill |
|---|---|---|---|
| PET intrinsic viscosity (ASTM D4603), dL/g | 0.76–0.84 | 0.80–0.86 | 0.82–0.86 |
| Neck finish | Crystallized neck typical | Crystallized neck, pressure rated | Crystallized neck, heat rated |
| Axial stretch ratio | 2.5–3.2 | 2.5–3.2 | 2.5–3.0 |
| Hoop stretch ratio | 3.5–4.5 | 3.5–4.5 | 3.0–4.0 |
| Total area stretch ratio | 10–16 | 10–16 | 9–14 |
| Preform conditioning temperature, degrees C | 95–115 | 95–115 | 100–115 |
| Mold temperature, degrees C | 8–15 | 8–15 | 130–150 |
New machines matter here because they hold these windows more tightly. A machine with fine oven zone control and stable servo stretching hits the target stretch ratios and conditioning temperature repeatably, which lets the designer push resin down toward the lightest safe bottle. An old machine with coarse oven zones and hydraulic instability needs a wider process margin, which usually means a heavier preform to guarantee that every bottle passes, and a heavier preform is a permanent resin penalty paid on every bottle.
The intrinsic viscosity band also links to recycled content. Higher recycled content tends to lower and widen the viscosity distribution, so a water grade at 0.76 to 0.84 becomes harder to hold at the bottom of the band when recycled material is blended in. New machines with better control tolerate that variation; legacy machines often cannot, forcing either a higher virgin top up or a heavier bottle. The parameter table is therefore not abstract: it is the mechanical reason newer equipment supports lighter, cheaper bottles.
Yield and Scrap Rate: The Hidden Cost Multiplier
Scrap is the quiet tax on old equipment. Every bottle that fails still consumed resin, energy, labour and machine time, and it still incurred a share of depreciation, yet it produced no saleable output. The cost of scrap is therefore not the value of the lost bottle but the value of everything spent to make it plus the overhead allocated to it, all shifted onto the good bottles.
Yield Levels and Scrap Multiplication
| Metric | New Generation Machine | Legacy Machine |
|---|---|---|
| Good bottle yield | 99.2–99.8 percent | 96.0–98.5 percent |
| Scrap rate | 0.2–0.8 percent | 1.5–4.0 percent |
| Per point of scrap on unit cost | Roughly 1.0–1.4 percent increase in effective per bottle cost | |
| Structural yield penalty of legacy | 1.5–4.0 percent higher unit cost before downtime | |
The multiplier is the key idea. Because scrap consumes input without producing output, each single percentage point of scrap lifts the effective per bottle cost by roughly 1.0 to 1.4 percent once material, energy, overhead and rework are allocated. A legacy line running at 96 to 98.5 percent yield therefore carries a 1.5 to 4.0 percent structural cost penalty against a new line at 99.2 to 99.8 percent yield, and that penalty is permanent and recurring. It is also invisible on a purchase order, which is exactly why buyers underestimate old equipment.
Scrap from legacy machines is rarely random. It clusters around the same failure modes: uneven preform heating from aged lamps, inconsistent stretch from hydraulic drift, neck defects from worn blow pins, and top load failure from marginal wall distribution. New machines reduce these through stable servo motion, fresh heating elements, better process monitoring and automatic reject sorting, so the scrap difference is an engineering consequence of age rather than operator skill. The cost comparison that ignores scrap is missing the second largest operating gap after energy.
OEE Structure and Changeover Time
Overall equipment effectiveness is the honest measure of how much of the available time a machine spends making good bottles. It multiplies three factors: availability, which is run time over planned time; performance, which is actual speed over theoretical speed; and quality, which is good bottles over total bottles made. A machine can have a high theoretical speed and still post a poor overall equipment effectiveness if it stops often, runs slow or makes scrap.
OEE Factor Comparison
| OEE Factor | New Generation Machine | Legacy Machine |
|---|---|---|
| Availability | 90–95 percent | 80–88 percent |
| Performance | 95–98 percent | 82–92 percent |
| Quality | 99.2–99.8 percent | 96.0–98.5 percent |
| Overall equipment effectiveness | 85–92 percent | 65–80 percent |
| Mold changeover time | 15–30 minutes | 45–90 minutes |
The overall equipment effectiveness gap is large in percentage terms and enormous in bottle terms. Moving from 65 to 80 percent overall equipment effectiveness up to 85 to 92 percent means a 15 to 30 percent increase in good bottles from the same footprint and the same shift pattern, with no extra labour and no extra floor space. For a plant constrained by capacity, that uplift can defer or remove the need for a second line, which is itself a capital saving larger than the energy saving.
Changeover time is the lever most often ignored. A legacy machine takes 45 to 90 minutes to swap a mold, while a new fast changeover design does it in 15 to 30 minutes. For a plant with several stock keeping units per day, that difference is an hour or more of lost production per changeover, repeated every day. Over a year of frequent changeovers the lost output equals a meaningful fraction of a shift, and it is output that a new machine simply recovers for free. New machines achieve this with modular tooling, quick locating systems and servo preset recipes that reload at the push of a button, whereas legacy machines need manual shimming, dialling and trial blows.
Maintenance, Wear Parts and End-of-Life Risk
Maintenance cost rises non linearly with machine age. A new machine sits under warranty, runs with fresh components and follows a predictable preventive schedule. A legacy machine has aged seals, drifted hydraulics, dimming heaters and a growing list of parts the original supplier no longer stocks. The maintenance difference is not only the cost of parts but the cost of finding them and the cost of the stoppages while they are found.
Wear Parts and Life Expectations
| Wear Part | Typical Service Life | Cost and Risk Note on Legacy Units |
|---|---|---|
| Heater lamp | 6000–10000 hours | Aged lamps drift in output; exact legacy types may be discontinued |
| Stretch rod seal | Periodic, application dependent | Wear causes pressure loss and defective necks |
| High pressure valve block | Long, inspection based | Proportional valves may be end of life and slow to source |
| Blow pin | High cycle life | Worn tips raise scrap and acetaldehyde risk |
| Stretch rod | Long, inspection based | Bending or scoring ruins wall distribution |
| Mold clamp mechanism | Long, lubrication based | Slack clamping causes flash and dimensional drift |
The dominant maintenance risk on old equipment is end of life components. Original heaters, proportional valves, servo drives, encoders and even the programmable logic controller of an obsolete generation may be discontinued, forcing expensive bespoke fabrication or a full control retrofit that costs more than the buyer budgeted. As the installed base of a given legacy model shrinks, third party parts become scarce and prices for the few remaining originals climb, so maintenance cost per hour trends upward with age rather than staying flat.
New machines invert this. Fresh wear parts run to their full life, the supplier stocks every component, and remote monitoring can flag drift before it becomes scrap or stoppage. YuDa machines, for example, include remote monitoring through which engineers at the China headquarters can read programmable logic controller data on a live link and feed abnormal trends back to the customer site, turning maintenance from reactive to predictive. That capability simply does not exist on a legacy controller, and it is a real operating cost difference, not a marketing claim.
Lightweighting and rPET Compatibility
Two market forces now push every bottler toward lighter bottles and higher recycled content, and both favour new equipment. Lightweighting reduces resin per bottle, which is the largest single component of unit cost. Recycled content answers regulation and brand commitments but makes the process harder to hold.
Lightweighting and rPET Capability
| Capability | New Generation Machine | Legacy Machine |
|---|---|---|
| 500 mL water bottle weight | 8.5–9.5 grams | 12–13 grams |
| Bottle weight reduction | 8–20 percent achievable | Limited, needs process margin |
| Neck finish upgrade PCO1810 to PCO1881 | 1.2–1.5 gram saving supported | Often not compatible |
| rPET blend tolerance | 25–100 percent manageable | Low blends only, unstable |
The resin saving is large. A 500 millilitre water bottle that weighed 12 to 13 grams on older tooling and process can be taken to 8.5 to 9.5 grams on a new machine with modern preform design and tight process control, an 8 to 20 percent resin reduction that repeats on every bottle for the life of the product. Moving from the older PCO1810 neck finish to the shorter PCO1881 neck saves a further 1.2 to 1.5 grams per bottle at the closure interface. At high annual volume those grams become a substantial annual resin saving, frequently larger than the entire energy saving, and it is a saving only a new or well refurbished machine can capture.
Recycled content is the harder test. Recycled PET has lower and more variable intrinsic viscosity, higher moisture sensitivity and stricter acetaldehyde control needs, so it demands finer oven zone control, stable servo motion and tighter preform drying. Legacy machines with coarse oven zones and hydraulic instability hold quality only at low recycled content, whereas new machines with zone level control and remote data monitoring manage blends from 25 to 100 percent far more reliably. Customers whose markets impose recycled content mandates therefore find that old equipment is not merely costlier to run but incapable of meeting the specification at all.
Compliance and Market Access
Used equipment carries a compliance burden that new equipment does not, and that burden is easy to overlook because it appears after purchase rather than on the purchase order. Food contact law, machinery safety law and energy management expectations all move over time, so a machine built to an earlier rule set may need rework to sell into current markets.
Standards and Market Access Requirements
| Requirement | Reference | Relevance to New vs Old |
|---|---|---|
| Food contact, United States | FDA 21 CFR 177.1630 | Newer machines ship with current declarations |
| Food contact, Europe | EU 10/2011 | Legacy machines may lack valid dossier |
| Food contact, China | GB 4806.6, GB 4806.7 | Domestic market access requirement |
| Acetaldehyde migration limit | Below 3 ppm, water below 1 ppm | New ovens control AA far better |
| Machine safety, Europe | CE, EN ISO 12100, EN 415-3 | Older control may not meet current expectations |
| Energy management | ISO 50001 | New machines give measured energy per 1000 bottles |
| Intrinsic viscosity test | ASTM D4603 | Needed for rPET and grade control |
The acetaldehyde limit is a good example of why age costs. Acetaldehyde is the compound that gives a slight taste to water in PET bottles, and heating profiles that are too hot or uneven raise it. The common limit is below 3 parts per million, with still water often held below 1 part per million. New ovens with near infrared heating and precise zone control keep acetaldehyde low; aged quartz ovens with drifting lamps struggle, and the result can be rejected lots or customer complaints that no purchase price saving offsets.
On the safety side, CE marking, EN ISO 12100 and EN 415-3 describe the current machinery safety expectation for blow molding equipment in European and many export markets. A legacy machine may carry an outdated or missing Declaration of Conformity, and its obsolete control components may no longer satisfy current electromagnetic compatibility or low voltage expectations. Bringing used imported equipment into compliance can cost more than buyers expect and should be priced before purchase, not discovered at the audit.
Buyer Decision Matrix by Business Profile
The right answer to new versus old is not the same for every buyer. It depends on volume, shift pattern, market requirements, capital constraint and risk tolerance. The matrix below maps four typical business profiles to the option that usually minimises total cost of ownership for that profile.
Business Profile Decision Matrix
| Business Profile | Volume and Context | Usually Best Option | Reasoning |
|---|---|---|---|
| Small batch startup | Low, intermittent, few SKUs | Semi automatic new or used | Lowest entry, labour acceptable at low volume |
| Regional mid size filler | Steady, mixed SKU, 1–2 shifts | New linear or refurbished | Balance of capital and operating cost |
| Large beverage group | High, continuous, many lines | New rotary high speed | Lowest per bottle cost, best OEE |
| Contract manufacturer or OEM | Variable specs, audit driven | New linear plus refurbished mix | Flexibility and documentation for customer audits |
The startup case is the only one where used or semi automatic equipment commonly wins on total cost, because volume is too low for energy and scrap differences to compound, and flexibility matters more than efficiency. The regional filler is the classic swing case where refurbishment is most attractive, capturing much of the new machine’s efficiency at a lower capital outlay. The large group should almost always buy new rotary, because the per bottle economics and the capacity uplift dominate. The contract manufacturer needs documentation and flexibility for customer audits, which pushes it toward new linear machines with complete conformity files, sometimes supplemented by refurbished capacity for overflow.
This matrix is the practical output of the whole comparison. It says the new versus old decision is not about which machine is “better” in the abstract but about matching the equipment age and class to the operating reality. A buyer who forces a legacy machine into a high volume continuous role, or a new rotary line into a low volume intermittent role, will pay a penalty either way.
Refurbished Equipment: The Middle Option
Refurbished equipment is the option between new and used that the simple binary comparison misses. A refurbishment takes a sound mechanical base and upgrades the parts that age worst: the control system, the drives, the heating oven and the air system. Done well, it recovers most of the efficiency gap at a fraction of the new machine’s capital.
Refurbishment Upgrade Benefits
| Upgrade | Relative Cost to Add | Benefit |
|---|---|---|
| Control system retrofit | Medium | OEE up 10–20 points, remote ready |
| Servo drive retrofit | Medium to High | Drive energy down 25–40 percent |
| Heater box conversion | Medium | Energy down 20–35 percent, better AA control |
| High pressure air recovery add on | Medium | Blowing air cost down 15–30 percent |
A refurbished machine typically lands at a procurement index of 60 to 78 against new at 100, while recovering much of the energy and availability gap. The control retrofit alone can lift overall equipment effectiveness by 10 to 20 points, the servo retrofit cuts drive energy by 25 to 40 percent, the heater box conversion cuts oven energy by 20 to 35 percent and improves acetaldehyde control, and the air recovery add on cuts blowing air cost by 15 to 30 percent. Together these can take a legacy machine from an operating cost index near 120 to 160 down toward 80 to 100, which is close to a new machine on running cost at far lower capital.
The caveat is the base. Refurbishment only pays when the frame, oven conveyor, mold base and structural components are sound. If the base is worn or if key structural spare parts are end of life, the refurbishment becomes a money pit that still cannot reach new machine performance. A proper refurbishment also renews wear parts to full life and re documents compliance, so it should be specified and quoted as a defined scope rather than bought as a vague “reconditioned” label. YuDa’s modular design philosophy, with convenient and cost saving maintenance and changeovers, makes its machines a strong refurbishment base because components are standardised and documented.
Total Cost of Ownership and Lifecycle Thinking
Total cost of ownership is the discipline of counting every cost over the equipment life, not only the purchase price. For PET bottle blowing equipment the life is long and the operating costs dominate, so the acquisition number is a small part of the true picture. The useful split is capital expenditure versus operating expenditure, where operating expenditure covers energy, resin scrap, labour, maintenance, parts and downtime.
Lifecycle Cost Structure
| Lifecycle Element | New Generation Machine | Legacy Machine |
|---|---|---|
| Capital expenditure share of lifecycle | Lower share, 30–40 percent | Higher share of a smaller base, but… |
| Operating expenditure share of lifecycle | 60–70 percent, lower absolute | 75–85 percent, higher absolute |
| Upgrade payback window | n/a as new | Refurbishment recovers in 18–30 months |
| Residual value at five years | 45–55 percent | 10–20 percent |
The apparent paradox is that the new machine has a higher capital expenditure yet often a lower total cost of ownership, because its operating expenditure is so much lower in absolute terms. The legacy machine’s smaller capital base is overwhelmed by higher energy, higher scrap, higher maintenance and higher downtime across the operating life. Only when volume is low does the capital saving hold up, because the operating penalties have fewer bottles over which to compound.
Residual value closes the case. After a five year horizon a well maintained new machine typically retains 45 to 55 percent of its acquisition value, a refurbished machine 35 to 45 percent, a used three to five year old machine 25 to 35 percent and a legacy eight to twelve year old machine only 10 to 20 percent. Residual value is recovered capital at replacement time, so it lowers the true net cost of the newer option and should be subtracted from its lifecycle cost, widening the gap with the legacy machine further.
The investment recovery window for an upgrade rather than a pure purchase is the practical planning number. A refurbishment or a new machine bought to replace a costly legacy line commonly recovers its extra outlay across 18 to 30 months through energy, scrap and downtime savings, after which the saving flows straight to margin. Stating the decision as a payback in months rather than as a price keeps the comparison honest and avoids any need for absolute currency figures.
Cost Index Comparison: New vs Old at a Glance
The index table below consolidates the whole comparison into one view. It sets a new generation automatic linear machine at a procurement index of 100 and expresses every other option as a fraction of that, then does the same for the operating cost index with the legacy machine as the 100 baseline so the running penalty is visible. This is the cleanest way to compare without reference to currency, region or negotiation.
Consolidated Cost Index
| Option | Procurement Index (new = 100) | Operating Cost Index (legacy = 100) | Typical OEE | Five Year Residual |
|---|---|---|---|---|
| New rotary high speed | 130–180 | 40–55 | 88–92 percent | 50–60 percent |
| New linear automatic | 100 | 45–60 | 85–90 percent | 45–55 percent |
| Refurbished (control, servo, heater, air) | 60–78 | 80–100 | 80–88 percent | 35–45 percent |
| Used 3–5 years, original generation | 45–60 | 90–110 | 75–82 percent | 25–35 percent |
| Legacy 8–12 years | 25–40 | 120–160 | 65–80 percent | 10–20 percent |
| New semi automatic | 30–45 | 100–130 | 70–82 percent | 35–45 percent |
Read across the rows and the story is consistent. The new linear automatic has the highest procurement index but the second lowest operating index and the second highest residual value. The legacy machine has the lowest procurement index but the highest operating index and the lowest residual value, so on a total cost of ownership basis it is usually the most expensive choice once volume is real. The refurbished option sits in the middle with a procurement index well below new and an operating index close to new, which is why it is the rational swing choice for the regional filler.
The rotary high speed row is the one that breaks the procurement intuition: its procurement index is highest of all at 130 to 180, yet its operating index is lowest at 40 to 55 and its residual value highest at 50 to 60 percent. For a large beverage group running continuous high volume, that combination gives the lowest total cost of ownership despite the largest capital outlay, because per bottle cost is minimised and capacity is maximised. The index method makes this visible without a single currency figure.
Sourcing, Documentation and Supplier Factors
The cost comparison is also shaped by the supplier, because a large share of the compliance and commissioning workload originates with the equipment supplier rather than the plant. Conformity declarations, pressure vessel certificates, material certificates for product contact surfaces, food grade lubricant statements, calibration records and local language manuals all arrive with the machine or do not arrive at all. A supplier that delivers complete documentation removes a block of work; a supplier that does not creates hidden cost and delay.
Buyers comparing PET blow molding suppliers, whether international builders such as Sidel, Krones, SIPA, Sacmi, AOKI or Chumpower, or Chinese manufacturers such as YuDa, should weight documentation completeness alongside output rate and price level. YuDa, a Wanplas factory and one of China’s leading PET bottle blow molding machine manufacturers with more than twenty patents, supplies the FGX high speed series, standard speed full automatic and semi automatic machines, and linear blowing filling capping CombiBlock systems that reduce the number of interfaces a plant must validate. Fewer interfaces mean fewer qualification documents, which is itself a cost advantage in a new or replacement project.
Remote monitoring and spare parts logistics are the other supplier driven cost factors. A supplier with remote diagnostics can resolve many faults without a site visit, reducing downtime cost, and a supplier with regional parts stock turns a potential multi week wait into a multi day one. The Wanplas brand commitment to spare parts, transport, capacity and quality support, applied through YuDa, matters most precisely when the machine is old enough that the buyer is weighing whether to keep it or replace it. For a legacy third party machine with no local support, the hidden cost of every stoppage should be entered into the comparison explicitly rather than hoped away.
Implementation Roadmap for a Replacement Decision
Turning this comparison into action needs a short, disciplined process so the decision is made on total cost of ownership rather than on the purchase number. The roadmap below works for a plant deciding whether to keep a legacy line, refurbish it, or buy new.
- Baseline the current line. Measure actual energy per thousand bottles, yield, overall equipment effectiveness, changeover time, scrap reasons and unplanned downtime over a representative month. Without this baseline no comparison is real.
- Score every candidate on the ten dimensions. Use relative levels and the index method, not absolute prices, and include installation, compliance and residual value alongside acquisition.
- Model the lifecycle. Split capital expenditure and operating expenditure, apply the payback window of 18 to 30 months for upgrades, and subtract residual value at five years from each option.
- Match to business profile. Use the decision matrix to confirm the option fits volume, shift pattern and market requirements rather than personal preference.
- Price the hidden items. Add compliance rework, spare parts risk, documentation gaps and downtime probability for any legacy or used option before finalising.
- Decide and schedule. Choose new, refurbished or used, then time installation to a low demand period and validate the new or refurbished line against the baseline so the saving is proven, not assumed.
This roadmap prevents the two classic errors: buying used to save capital and then paying it back many times in energy, scrap and stoppages, and buying new without proving the operating saving against a measured baseline, which leaves the value unrealised. The discipline of measurement is what makes the index comparison trustworthy.
Frequently Asked Questions
How should a buyer compare new and used PET blow molding machine cost fairly?
Compare on total cost of ownership rather than purchase price alone. Use an indexed approach where a new generation automatic linear machine is set at a procurement index of 100 and every alternative is scored against it for acquisition, energy, scrap, maintenance, downtime and residual value. A used machine may show a procurement index of only 25 to 60, yet its operating cost index is frequently 110 to 160 because of older heating, hydraulic drives and higher scrap, which narrows or removes the saving over the operating life.
Does a newer machine pay back its higher purchase price through energy savings?
In continuous high volume operation it commonly does. Moving from a quartz lamp oven and hydraulic drive to near infrared heating with servo motion and high pressure air recovery lowers unit energy from about 0.22 to 0.35 kilowatt hours per thousand bottles down to 0.12 to 0.18, a reduction of 35 to 55 percent, and servo retrofit alone saves 25 to 40 percent of drive energy. With two shift running the energy saving alone often recovers the extra acquisition premium across a payback window of roughly 18 to 30 months.
How much does scrap rate affect unit cost?
Material, energy, labour and depreciation are all consumed by every bottle made, including the ones rejected. Each single percentage point of scrap lifts the effective per bottle cost by roughly 1.0 to 1.4 percent once material, energy, overhead and rework are allocated. A legacy line running at 96 to 98.5 percent yield therefore carries a 1.5 to 4 percent structural cost penalty against a new line at 99.2 to 99.8 percent yield, before any downtime is counted.
Is refurbishing an old machine cheaper than buying new?
Refurbishment sits between the two extremes. A control upgrade, servo retrofit, heater box conversion and air recovery add on typically lands at a procurement index of 60 to 78 against new at 100, and recovers much of the energy and availability gap. It is the rational choice when the mechanical frame, oven conveyor and mold base are sound but the controls, drives and heating are obsolete. It is a poor choice when the base frame is worn or when spare structural parts are end of life.
Can old blow molding machines run rPET blends?
Mechanically most can, but process control is the limiting factor. Recycled PET has lower and more variable intrinsic viscosity, higher moisture sensitivity and stricter acetaldehyde control needs, so it demands finer oven zone control, stable servo motion and tighter preform drying. Legacy machines with coarse oven zones and hydraulic instability hold quality only at low recycled content, whereas new machines with zone level control and remote data monitoring manage blends up to 25 to 100 percent far more reliably.
What spare parts availability problems appear with legacy equipment?
The dominant risk is end of life components. Original heaters, proportional valves, servo drives, encoders and even the programmable logic controller of an obsolete generation may be discontinued, forcing expensive bespoke fabrication or full control retrofits. Wear parts such as heater lamps with 6000 to 10000 hour life, stretch rod seals, high pressure valve blocks, blow pins and mold clamp mechanisms also become scarce and expensive as the installed base shrinks.
How does overall equipment effectiveness differ between new and old blowing lines?
New lines typically reach an overall equipment effectiveness of 85 to 92 percent, combining 90 to 95 percent availability, 95 to 98 percent performance and 99.2 to 99.8 percent quality. Legacy lines more often sit at 65 to 80 percent overall equipment effectiveness because availability falls to 80 to 88 percent and performance to 82 to 92 percent, worsened by long changeovers of 45 to 90 minutes against 15 to 30 minutes on new fast changeover designs.
What compliance risk comes with used imported equipment?
Used machines may carry an outdated or missing Declaration of Conformity, obsolete control components that no longer meet current electromagnetic compatibility or low voltage expectations, and no validated food contact documentation for the markets you serve. Bringing a legacy machine into compliance with CE machinery safety under EN ISO 12100 and EN 415-3, plus food contact rules such as FDA 21 CFR 177.1630, EU 10/2011 and GB 4806.6 and GB 4806.7, can cost more than buyers expect and should be priced before purchase.
When does a semi automatic machine make sense versus a fully automatic line?
Semi automatic equipment carries a procurement index of roughly 30 to 45 against new automatic at 100 and suits low and intermittent volume, multiple short runs, pilot lines and markets where labour cost is low and energy cost is not yet decisive. It becomes expensive per bottle once volume rises, because labour, lower yield and higher unit energy dominate. The crossover is usually somewhere between a few hundred and a few thousand bottles per hour of steady demand.
What is the residual value difference between new, refurbished and legacy machines?
After a five year operating horizon a well maintained new machine typically retains 45 to 55 percent of its acquisition value, a refurbished machine 35 to 45 percent, a used three to five year old machine 25 to 35 percent and a legacy eight to twelve year old machine only 10 to 20 percent. Residual value matters because it is recovered capital at replacement time and it lowers the true net cost of ownership of the newer option.
Conclusion
The cost comparison of new and old PET bottle blowing production equipment is decided not by the purchase order but by the operating life. A legacy machine wins on exactly one dimension, acquisition price, and loses or ties on the other nine that determine true cost: energy, scrap, overall equipment effectiveness, changeover, maintenance, spare parts, control generation, compliance and residual value. At low and intermittent volume that single win can hold; at continuous high volume it is almost always erased and then reversed by the compounding of energy and scrap differences across hundreds of millions of bottles per year.
The index method used throughout this guide keeps the comparison honest without reference to currency or region. Setting a new generation automatic linear machine at a procurement index of 100 shows the legacy machine at 25 to 40 on capital but 120 to 160 on operating cost, while a refurbished machine at 60 to 78 on capital closes most of the operating gap and becomes the rational swing choice for regional fillers. The rotary high speed line, despite the highest capital index of 130 to 180, posts the lowest operating index and the highest residual value, making it the lowest total cost option for large beverage groups.
Equipment choice is also a compliance and documentation decision, not a separate one. A supplier that delivers complete conformity documentation, vessel certificates, food grade declarations, calibration records and local language manuals with the machine removes a block of hidden work, and remote monitoring plus regional parts stock directly lower downtime cost. YuDa, a Wanplas factory with more than twenty years in PET bottle blow molding and installations in over sixty countries, builds FGX high speed machines, standard speed full automatic and semi automatic machines, and linear blowing filling capping CombiBlock systems, backed by remote monitoring, modular tooling and the Wanplas brand commitments on spare parts, transport, capacity and quality. Teams weighing new against old PET bottle blowing production equipment are welcome to bring their measured baseline, volume profile and market requirements to the YuDa engineering group, so the decision rests on proven total cost of ownership rather than on the sticker alone.