Payback period is the single number that decides whether a PET bottle project moves from a feasibility folder to a purchase order. Yet in global practice the same nominal line configuration can return capital in fourteen months in one plant and still be underwater at forty months in another, with identical machine nameplates. The difference is almost never the machine brochure. It lies in how many qualifying bottles the asset actually delivers per operating hour, how many grams of resin each of those bottles carries, how many kilowatt-hours and cubic metres of compressed air are consumed per thousand bottles, and how many hours per month the line stands still for changeovers, wear part replacement, and quality holds.
This analysis deliberately avoids monetary figures. Currency values distort cross-border comparison, drift with exchange rates and resin markets, and obscure the physical relationships that engineers can actually control. Instead the discussion is expressed in physical and dimensionless terms: bottles per hour (BPH), grams of preform weight, kilowatt-hours per 1,000 bottles, normal cubic metres of compressed air per 1,000 bottles, litres of water per 1,000 bottles, overall equipment effectiveness (OEE) percentage, scrap rate percentage, mean time between failures (MTBF) in hours, and payback expressed in months. Where relative economics are unavoidable, a dimensionless cost index is used with a baseline of 1.00.
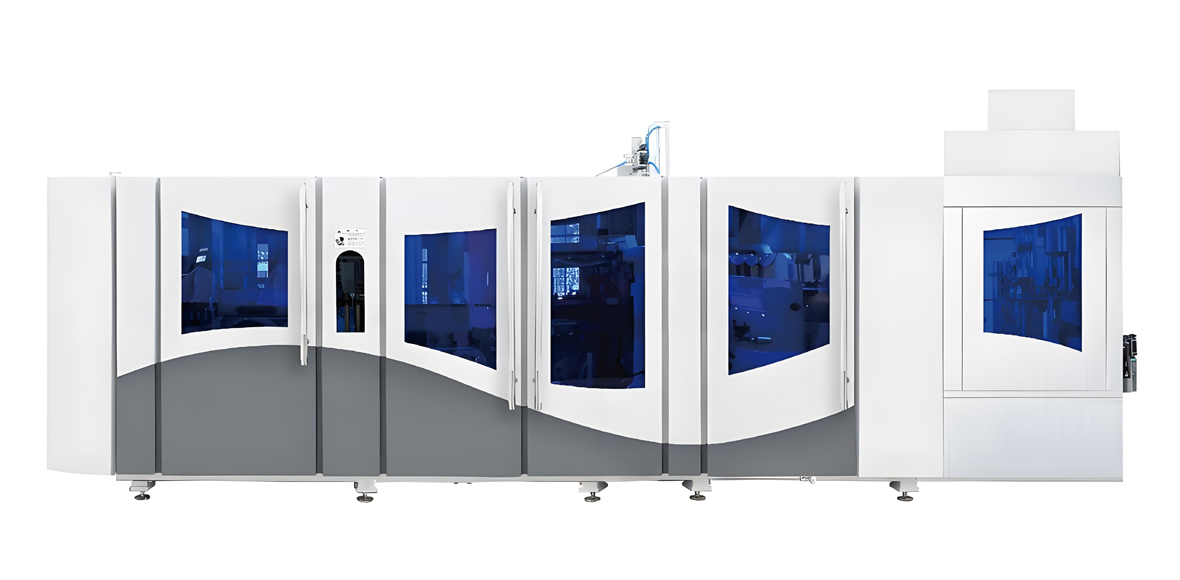
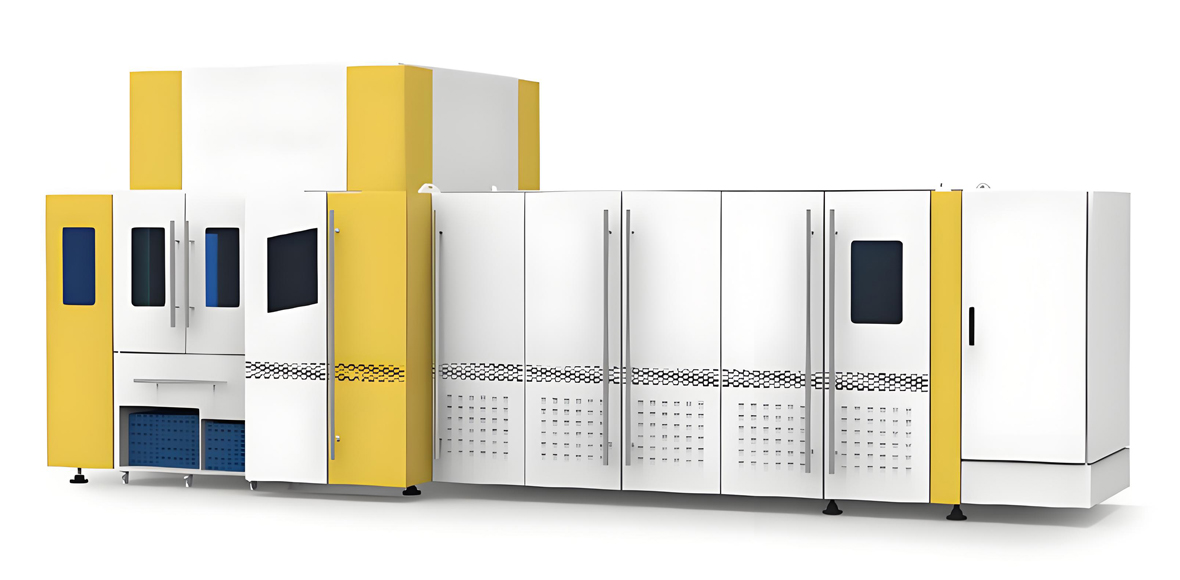
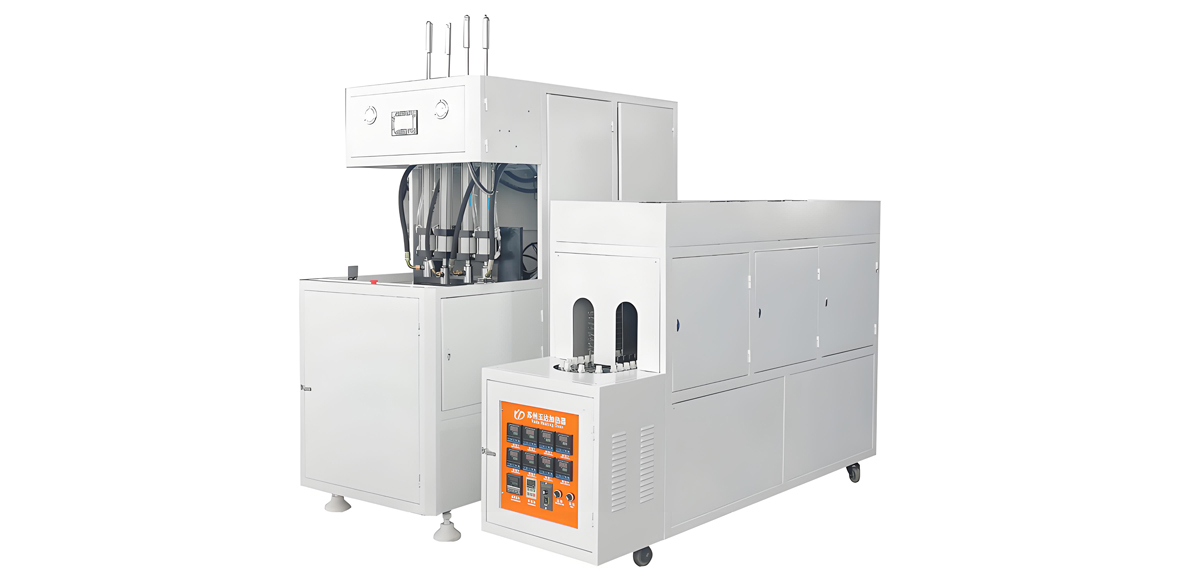
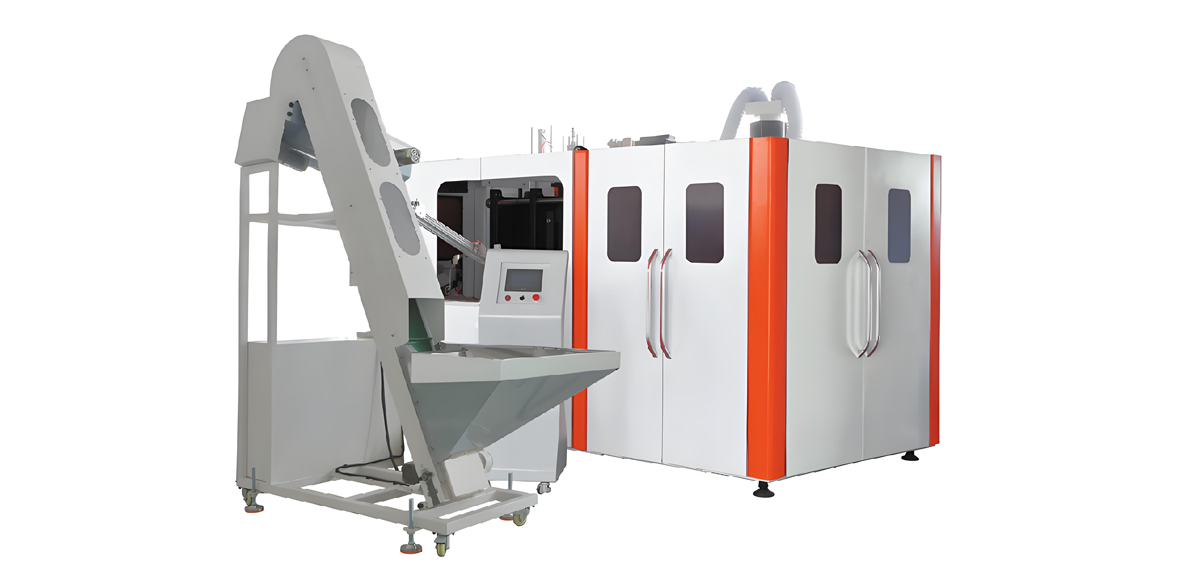
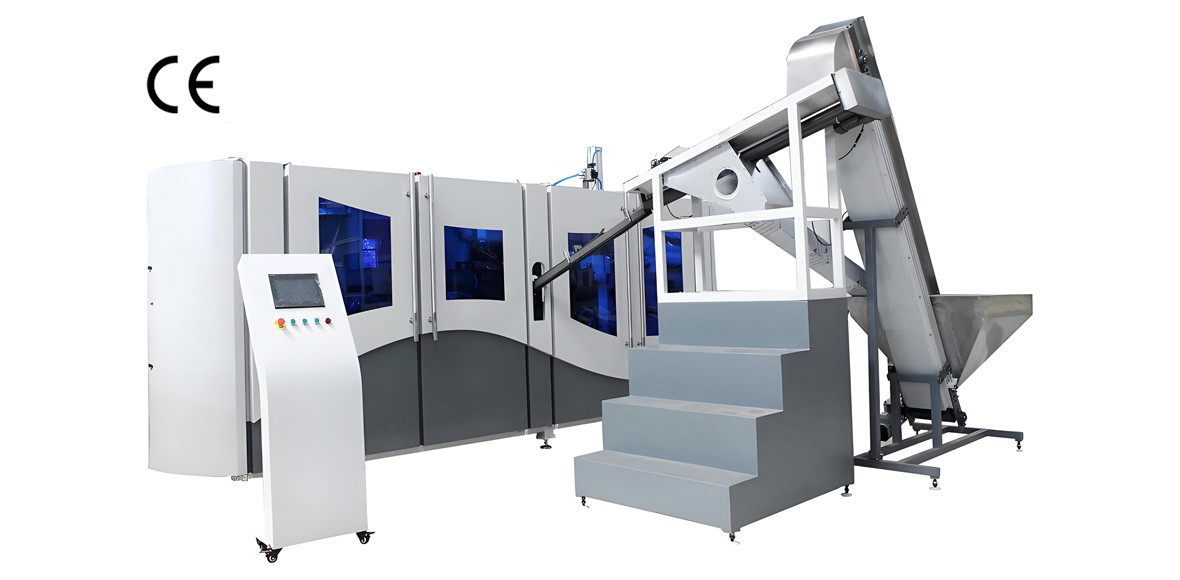
The technical reference frame throughout is the equipment range of YuDa, a Wanplas factory specialising in PET bottle blow molding machines, with more than 20 years of experience, 20+ patents, and exports to over 60 countries. YuDa’s semi-automatic series, standard-speed full automatic series (1,000–7,000 BPH), FGX high-speed series (8,000–15,000 BPH), and linear blowing-filling-capping combiblock cover the full spectrum of plant archetypes discussed below. Benchmarks against other international builders such as Sidel, Krones, SIPA, and Aoki are included so the ranges reflect the global installed base rather than one vendor’s best case.
What Payback Period Actually Measures in a PET Bottle Plant
Payback period in a PET bottle factory is the number of operating months required for cumulative surplus generated by the line to equal the total installed asset commitment. In physical terms, it is a race between two counters: the number of qualifying bottles produced and the number of calendar months elapsed. Every factor that raises the first counter or delays the second shortens payback, and the engineering levers that do so are surprisingly few but very powerful.
The first common error is to treat nameplate capacity as the numerator. A 12-cavity FGX-class machine rated at 24,000 BPH does not produce 24,000 saleable bottles per hour. After planned changeovers, unplanned stops, speed losses caused by oven stabilisation, and the reject stream from preform defects and blow faults, the realistic output is between 14,000 and 20,000 qualifying bottles per hour depending on plant discipline. Payback models built on nameplate output typically understate the real period by 40 to 70 percent, which is the origin of most disappointed investors.
The second error is to model only the machine and ignore the utility island. In a PET stretch blow molding plant the high-pressure air compressor, the low-pressure service compressor, the chiller, the cooling tower, the dryer, and the air treatment train frequently represent 25 to 40 percent of the total installed asset base and a similar share of running energy. A payback model that omits them is not conservative; it is simply wrong. Correctly scoped, the boundary of the payback calculation should include the blow machine, mould sets, preform handling, utilities, air treatment, conveying, and any inline filling or capping block.
The third and most subtle error is ignoring ramp-up. Global commissioning experience suggests a new PET line reaches only 40 to 60 percent of its steady-state OEE in month one, 65 to 80 percent by month three, and full steady-state by month five to eight. That ramp curve alone adds two to four months to payback and should be modelled explicitly rather than assumed away.
Building a Currency-Free Payback Model
A currency-free payback model expresses the asset base as a dimensionless investment index and the monthly surplus as a dimensionless contribution index, then divides one by the other to obtain months. The approach is robust because it isolates the physical drivers that engineers actually influence, and it remains valid whether the plant is in Southeast Asia, West Africa, the Gulf, Latin America, or Eastern Europe.
The structure is straightforward. Define the total installed asset base as investment index 1.00 for a chosen reference configuration. Define the monthly qualifying bottle output as the product of nameplate BPH, scheduled hours per month, OEE, and good-bottle yield. Define the per-bottle input burden as the sum of resin mass, specific energy, specific air, specific water, labour hours allocated, and consumable allocation, each normalised against the reference. Payback in months then becomes the investment index divided by the monthly contribution index, where contribution index is qualifying output multiplied by the gap between the value index of a finished bottle and the summed input burden index.
| Variable | Unit | Typical global range | Best-practice target | Effect on payback |
|---|---|---|---|---|
| Nameplate output | BPH | 1,200–36,000 | Matched to demand, not maximised | Indirect |
| Overall equipment effectiveness | % | 45–85 | 78–85 | Very high |
| Good-bottle yield | % | 95.0–99.6 | >99.0 | High |
| Preform weight, 500 mL still water | g | 7.5–14.0 | 8.5–9.5 | Very high |
| Specific electrical energy | kWh / 1,000 bottles | 9–30 | 10–14 | High |
| Specific compressed air | Nm³ / 1,000 bottles | 16–45 | 18–24 with recovery | High |
| Chilled water make-up | L / 1,000 bottles | 0.3–3.0 | <0.8 | Low |
| Format changeover | minutes | 35–180 | <50 | Medium-high |
| Mean time between failures | hours | 60–350 | >250 | Medium-high |
| Labour coverage | operator-hours / shift | 2–14 | 3–5 | Medium |
| Scheduled utilisation | h / month | 200–700 | 480–620 | Very high |
With this scaffold in place, each of the ten factors below can be examined as a lever that moves either the numerator or the denominator, and its influence quantified in months rather than in currency.
Factor One: Capacity Utilisation and OEE
Capacity utilisation is the dominant determinant of PET bottle factory payback, outranking machine price, resin grade, and even energy tariff structure. The reason is arithmetic: the asset base is fixed the day the line is commissioned, so every additional qualifying bottle spreads that fixed base thinner without a proportional increase in variable burden.
OEE decomposes into availability, performance, and quality. In PET stretch blow molding, availability is usually the weakest of the three. Typical availability losses come from preform feeding jams in the elevator and roller sorter, oven lamp failures, blow valve leaks, gripper misalignment at the transfer star, and mould cooling faults. Performance losses arise when operators run the line below nameplate to compensate for marginal preform quality or unstable oven profiles. Quality losses show up as pearling, uneven wall distribution, base rocking, thread deformation, and burst bottles at the leak tester.
Field data across the global installed base suggests the following bands. Small semi-automatic plants running one shift with manual preform loading achieve 45 to 60 percent OEE. Standard-speed full automatic lines in regional beverage plants achieve 62 to 76 percent. High-speed FGX-class lines integrated with filling under a disciplined maintenance regime achieve 78 to 86 percent. The gap between the bottom and top of this ladder is roughly a factor of 1.7 in qualifying output from the same nominal asset.
Translated into months, raising OEE from 55 percent to 75 percent on a mid-size line typically shortens payback by 8 to 14 months. No other single lever in this article delivers that magnitude. Practical routes to the improvement include closed-loop oven temperature control with pyrometer feedback on preform body temperature, condition monitoring on the high-pressure compressor, spare mould sets pre-heated offline, and structured shift handover with documented first-off inspection.
Factor Two: Cavity Count, BPH and Machine Class
Cavity count sets the ceiling on output, but the relationship between cavities and payback is not linear because both asset base and utility demand scale with cavities while demand for bottles usually does not. Over-specifying cavity count is one of the most common and most expensive errors in global PET projects.
In two-step reheat stretch blow molding, per-cavity output is remarkably consistent across builders: 1,200 to 1,600 BPH per cavity for standard-speed machines and 2,000 to 3,000 BPH per cavity for high-speed machines such as the YuDa FGX series. A 6-cavity FGX configuration therefore lands between 12,000 and 18,000 BPH, while a 2-cavity standard machine sits around 2,400 to 3,200 BPH. Rotary machines from Sidel and Krones reach comparable or higher per-cavity rates, and linear machines trade some speed for lower complexity and easier maintenance access.
| Configuration | Typical BPH | Investment index | Specific energy, kWh/1,000 | Break-even utilisation | Payback band, months |
|---|---|---|---|---|---|
| Semi-automatic, 2 cavity | 1,000–1,600 | 0.18 | 22–30 | ~35% | 28–48 |
| Full automatic, 4 cavity | 4,000–6,000 | 0.42 | 16–21 | ~45% | 22–36 |
| Full automatic, 6 cavity | 6,000–9,000 | 0.58 | 14–18 | ~52% | 20–32 |
| FGX high speed, 6 cavity | 12,000–18,000 | 0.82 | 12–15 | ~58% | 17–27 |
| FGX high speed, 8 cavity | 16,000–24,000 | 1.00 | 11–14 | ~62% | 15–24 |
| FGX high speed, 12 cavity | 24,000–34,000 | 1.35 | 10–13 | ~70% | 14–22 (if filled) |
The critical column is break-even utilisation. A 12-cavity line needs roughly 70 percent utilisation before its lower specific energy and lower labour intensity overcome its larger asset base. If the market can only absorb 55 percent of that output, the same investor would reach payback four to nine months sooner with an 8-cavity machine. The engineering rule of thumb is to size the blow line so that projected year-two demand corresponds to 70 to 80 percent of realistic sustained output, leaving headroom for growth without stranding capacity.
Mould cavity balance also matters. Uneven cavity-to-cavity wall distribution forces the whole line to run at the setting required by the worst cavity. Cavity-level pressure sensors and individual pre-blow timing trim, available on modern control platforms, typically recover 1 to 3 percentage points of performance efficiency.
Factor Three: Preform Design, Weight and Lightweighting
Resin represents the dominant share of per-bottle conversion burden, typically 60 to 75 percent of the total input index, which makes preform weight the highest-leverage material variable in the entire payback equation. A three-gram reduction on a 500 mL still water bottle is a larger effect than any conceivable energy optimisation.
Global lightweighting practice has moved 500 mL still water preforms from 14 g in the early 2000s to 9.0–9.5 g in mainstream production and 7.5–8.5 g in aggressive programmes using short-neck finishes. The enabling changes are the neck finish conversion from 30/25 to 29/25 or 26/22, thinner but taller preform bodies that raise the natural stretch ratio, and base designs with deeper petaloid or champagne geometry to hold top load with less material.
The physics constrains how far this can go. PET is stretched biaxially in the blow mould; axial stretch ratio of 2.5 to 3.2 and hoop stretch ratio of 3.5 to 4.5 combine into a planar stretch ratio of roughly 10 to 16. Within that window, strain-induced crystallisation raises wall crystallinity to about 20 to 25 percent, which is what gives the bottle its stiffness, clarity, and barrier. Below a planar ratio of roughly 8, orientation is insufficient and the bottle loses top load and creep resistance; above roughly 18, the wall thins locally and pearling or stress whitening appears.
| Bottle format | Preform weight, g | Resin IV, dL/g | Axial ratio | Hoop ratio | Blow pressure, bar | Top load target, kgf |
|---|---|---|---|---|---|---|
| 330 mL still water | 6.5–8.5 | 0.76–0.80 | 2.4–2.9 | 3.4–4.1 | 25–30 | 10–14 |
| 500 mL still water | 8.5–12.5 | 0.76–0.82 | 2.6–3.1 | 3.6–4.4 | 25–32 | 12–18 |
| 1.5 L still water | 22–30 | 0.78–0.82 | 2.7–3.2 | 3.8–4.5 | 28–34 | 18–26 |
| 1.5 L carbonated soft drink | 36–44 | 0.80–0.85 | 2.6–3.0 | 3.5–4.2 | 32–40 | 25–35 |
| 2 L carbonated soft drink | 45–54 | 0.82–0.86 | 2.7–3.1 | 3.6–4.3 | 34–40 | 30–40 |
| 500 mL hot-fill juice | 26–34 | 0.74–0.78 | 2.4–2.8 | 3.2–3.9 | 30–38 | 22–30 |
| 5 L water jar | 95–130 | 0.80–0.84 | 2.5–2.9 | 3.4–4.0 | 28–34 | 45–70 |
Every lightweighting step must be validated against the finished-container test set: top load, drop impact at fill temperature, thermal stability, burst pressure for carbonated formats, and dimensional stability after 24 hours. A lightweighting programme that trims 2 g but raises field failure by 0.5 percent destroys more value than it creates. Conservative practice is to reduce in 0.3 to 0.5 g increments with a full test panel at each step.
Preform quality also affects payback through the reject stream. Acetaldehyde content above roughly 8 ppm for water applications, crystallinity haze at the gate, off-centre wall distribution beyond 0.15 mm, and moisture above 50 ppm at the injection stage all produce blow defects that appear only downstream. Plants that buy preforms rather than injecting them should specify these limits contractually.
Factor Four: Energy Intensity of Heating, Blowing and Chilling
Specific energy consumption is the second largest controllable input after resin, typically representing 30 to 38 percent of the non-resin operating burden on a two-step PET line. Understanding where the kilowatt-hours go is the prerequisite for shortening payback through energy engineering.
On a well-instrumented high-speed line producing 500 mL still water bottles, the split of roughly 11 to 14 kWh per 1,000 bottles is approximately as follows: infrared reheat oven 32 to 40 percent, high-pressure air compression 33 to 42 percent, chilling and mould cooling 12 to 18 percent, machine servo drives and mechanics 6 to 10 percent, and conveying, air treatment, and ancillaries 4 to 8 percent. Older or poorly maintained lines drift to 20 to 30 kWh per 1,000 bottles, which more than doubles the energy burden.
Infrared reheat oven
The oven raises preform body temperature from ambient to 95–115 °C while keeping the neck finish below about 70 °C so the thread geometry and support ring remain dimensionally stable. Quartz infrared lamps of 2,000 to 3,000 W each are arranged in six to twelve vertical layers, with the preform rotating at 40 to 80 rpm to equalise circumferential absorption. PET absorbs efficiently in the near-infrared range around 1.0 to 1.6 μm, so lamp spectral matching is critical.
The single most effective oven design change is reducing lamp-to-preform distance. YuDa’s energy-saving oven architecture minimises heater distance to 38.1 mm, which raises radiative view factor and reduces reflector losses; in field comparison against conventional ovens this configuration saves over 30 percent of oven electricity. Additional gains come from ceramic back reflectors, forced neck cooling with a dedicated air knife, individual lamp layer power trim, and preform pitch matching so no lamp radiates into empty space during gaps.
High-pressure compressed air
Blowing air is supplied at 30 to 40 bar by a multi-stage piston compressor, with specific power in the range of 0.12 to 0.18 kWh per Nm³ delivered. Air demand per bottle is driven by container volume plus the dead volume of the valve block, blow nozzle, and manifold piping. For a 500 mL bottle blown at 32 bar, the geometric requirement is roughly 16 NL, while dead volume typically adds 60 to 130 percent, giving 26 to 38 Nm³ per 1,000 bottles on machines without recovery.
Air recovery is the highest-value energy retrofit in PET blowing. During mould opening, exhaust air at 25 to 35 bar is cascaded into the pre-blow circuit and the low-pressure service network rather than vented. Recovery ratios of 30 to 50 percent are achievable, dropping specific air to 18 to 24 Nm³ per 1,000 bottles. Combined with shortened valve block dead volume and correctly sized nozzles, total line energy typically falls 10 to 18 percent, expressed as a cost index of 1.00 baseline versus 0.82 to 0.90 after recovery.
Chilled water and mould cooling
Mould body cooling runs at 8 to 15 °C, with 10 to 12 °C the common setpoint for still water formats. The chiller must remove the latent and sensible heat that the oven put into the preform, so oven efficiency and chiller load are linked: every kilowatt-hour saved in the oven reduces chiller duty by roughly 0.25 to 0.35 kWh. Neck and base moulds usually run on a separate loop at 12 to 18 °C to avoid condensation and thread distortion. Closed-loop cooling with plate heat exchangers keeps make-up water below 0.8 L per 1,000 bottles in temperate climates, rising to 1.5 to 3.0 L per 1,000 bottles where evaporative towers operate in hot, dry conditions.
Factor Five: Two-Step Versus One-Step Process Route
The choice between two-step reheat stretch blow molding and one-step injection stretch blow molding changes the payback structure fundamentally, because it changes what the plant owns, what it buys, and how output scales with cavities.
In the two-step route, preforms are injection moulded separately, cooled to ambient, stored, and later reheated in an infrared oven before stretching and blowing. The preform can be produced in-house on a dedicated high-cavity injection machine or purchased from a specialist supplier. Because the blow station only has to reheat rather than melt, cycle times are short and per-cavity output is high. This route dominates water, carbonated soft drinks, edible oil, and household chemical bottles worldwide.
In the one-step route, injection, conditioning, stretching, and blowing occur in a single machine with the preform never cooling below its crystallisation window. The advantage is superior neck and gate quality, no preform handling scuffs, and no intermediate inventory. The disadvantage is that the injection stage governs the cycle, so per-cavity output is far lower and cavity counts must be high to reach volume. Wanplas’s Aibim factory, which specialises in injection blow and injection stretch blow machines from 3 mL to 1,000 mL, addresses exactly the segment where this trade-off favours one-step.
| Attribute | Two-step reheat SBM | One-step ISBM |
|---|---|---|
| Typical output per cavity | 1,200–3,000 BPH | 250–600 BPH |
| Practical volume window | 4,000 BPH and above | Below 4,000 BPH |
| Specific energy | 10–18 kWh / 1,000 bottles | 16–28 kWh / 1,000 bottles |
| Preform inventory needed | Yes, buffer stock | No |
| Neck and gate cosmetic quality | Good | Excellent |
| Wide-mouth and complex shapes | Limited | Strong |
| Changeover complexity | Medium | High |
| Investment index for equal volume | 1.00 | 1.4–2.1 |
| Typical payback band | 15–32 months | 20–40 months |
| Best-fit applications | Water, CSD, oil, detergent | Pharma, cosmetics, small dosing |
The practical decision rule is volume and value. Above roughly 4,000 BPH for a standard round bottle, two-step wins on payback almost without exception. Below that, and especially where the container is small, wide-mouthed, or carries a premium cosmetic or pharmaceutical specification, one-step frequently pays back faster because it eliminates preform logistics and reduces reject rates on cosmetically critical surfaces.
Factor Six: Changeover Time and SKU Complexity
Changeover is the quiet destroyer of payback in multi-SKU plants. A line producing a single format at constant speed may reach 82 percent OEE, while the same line producing eight formats can fall to 63 percent purely through format change losses, oven re-stabilisation, and first-off scrap.
A full format change on a PET blow line involves mould cavity sets, bottom moulds, neck guides and star wheel pockets, stretch rod length or tip, blow nozzle, preform elevator rails, air conveyor guide rails, and oven recipe. On older machines this takes 120 to 180 minutes. On modular designs with quick-clamp mould carriers, tool-less rail adjustment, and recipe-driven oven presets, the same change is completed in 35 to 55 minutes. YuDa’s modularised architecture is built for exactly this: mould-opening, mould-locking, and bottom mould elevation are integrated in a single cam-linked movement, which reduces the number of components that must be re-timed after a mould swap.
Beyond the mechanical change, oven re-stabilisation is often underestimated. After a preform weight change, the oven needs 8 to 20 minutes and 200 to 900 preforms to reach a stable body temperature profile, during which bottles are dimensionally out of specification. Pyrometer-based closed-loop control with stored recipes reduces this to 4 to 8 minutes and under 300 preforms.
Grouping SKUs by neck finish is the single most effective scheduling change. If all water SKUs share a 29/25 finish, changing between them requires only body mould and bottom mould, not neck guides or star wheels, cutting the change to 20 to 30 minutes. A plant that reorganises its schedule around neck-finish families commonly gains 3 to 6 OEE points, equivalent to roughly 2 to 4 months off payback.
Factor Seven: Reliability, MTBF and Wear Part Life
Reliability enters the payback equation twice: through lost availability and through the consumable burden of replacing worn components. Both are predictable, which means both are manageable.
Mean time between failures on a well-maintained PET blow line ranges from 250 to 350 hours; poorly maintained lines drop below 100 hours. The difference is rarely exotic. The recurring failure modes across the global installed base are blow valve seal leakage, stretch rod guide bushing wear causing off-centre stretching, infrared lamp end-of-life, preform gripper spring fatigue, solenoid pilot valve sticking from wet air, and high-pressure compressor valve plate failure.
| Component | Typical life | Early failure symptom | Availability impact if neglected |
|---|---|---|---|
| Infrared quartz lamps | 6,000–10,000 h | Drifting body temperature, uneven wall | Medium |
| Blow valve seals | 15–25 million cycles | Slow pressure rise, soft base | High |
| Stretch rod guide bushings | 8–15 million cycles | Off-centre base, rocking bottles | High |
| Solenoid pilot valves | 30–50 million cycles | Erratic pre-blow timing | Medium |
| Preform grippers and springs | 12–24 months | Dropped preforms at transfer | High |
| HP compressor valve plates | 4,000–8,000 h | Falling delivery, rising discharge temp | Very high |
| HP compressor piston rings | 8,000–12,000 h | Oil carryover, pressure loss | Very high |
| Mould cavity surfaces | 5–15 million shots | Vent blockage, surface marking | Medium |
| Air dryer desiccant | 24–36 months | Rising dew point, valve sticking | Medium |
| Chiller condenser cleaning | Quarterly | Rising approach temperature | Medium |
The high-pressure compressor deserves special attention because it is simultaneously the largest energy consumer after the oven and the component whose failure stops the entire line. A structured programme of valve plate inspection every 4,000 hours, oil analysis quarterly, intercooler cleaning, and discharge temperature trending typically raises line MTBF by 40 to 80 hours on its own.
Remote monitoring shortens repair time as much as it prevents failure. YuDa’s remote monitoring system allows engineers at the China headquarters to read PLC data and return diagnostic feedback to the customer site, which matters enormously for plants in regions without a local service base. Cutting average diagnostic delay from 48 hours to 4 hours on three incidents per year is worth roughly 1 to 2 OEE points.
Factor Eight: Labour Structure and Automation Depth
Labour affects payback less than resin or utilisation but more than most investors expect, and its influence is strongly regional. Expressed physically, a semi-automatic two-cavity line typically needs 8 to 14 operator-hours per shift once preform loading, bottle collection, bagging, and quality checks are counted. A fully automatic six-cavity line with air conveying and automatic bagging needs 3 to 5 operator-hours per shift. A combiblock integrating blowing, filling, and capping needs 4 to 7 operator-hours per shift for a far larger output.
The payback implication is not simply that fewer people cost less. It is that manual handling caps sustainable OEE. Manual preform loading limits realistic running time to roughly 70 percent of scheduled hours because operators must pause the line to replenish hoppers, and manual bottle collection introduces handling scuffs that raise the reject rate by 0.3 to 1.0 percentage points. Automation therefore improves both the availability and quality terms of OEE, compounding its effect.
In regions where labour is abundant, the semi-automatic route still makes sense for output below roughly 2,000 BPH, and YuDa’s semi-automatic series exists for exactly that segment with a low investment index and short delivery. Above 4,000 BPH, however, the automation payback is consistently favourable regardless of region, because the OEE and quality effects dominate the headcount effect.
Factor Nine: Regional and Climatic Variables
Payback periods for identical equipment vary systematically by region, and the drivers are physical rather than commercial. Understanding them prevents the common mistake of transplanting a temperate-climate plant design into a tropical or desert environment.
Ambient temperature and humidity
Chiller efficiency falls as ambient temperature rises. A chiller sized for 32 °C ambient will lose 12 to 20 percent of capacity at 45 °C, and its specific power rises correspondingly. In Gulf and equatorial installations, the correct response is to oversize condenser area by 20 to 30 percent and to specify a chiller with a design ambient of at least 45 °C rather than the standard 35 °C. Failing to do so shows up as mould temperature drift, base rocking, and a 2 to 5 percentage point loss in yield during the hottest months.
Humidity affects the compressed air train. High absolute humidity increases the load on the refrigerated dryer and shortens desiccant life. Where the dew point specification for blowing air is not met, moisture reaches the valve block, causes pilot valve sticking, and produces intermittent pre-blow timing faults that are extremely difficult to diagnose. Specifying a pressure dew point of at least -20 °C for the high-pressure circuit is standard practice in humid regions.
Power quality
Voltage dips and frequency instability cause servo drive faults and oven lamp thermal cycling that shortens lamp life. In regions with unstable grids, an automatic voltage regulator and a properly sized reactor on the drive bus typically pay for themselves in avoided downtime within the first year. Lamp life can be extended from 4,000 hours to the nominal 8,000 hours simply by eliminating repeated cold starts.
Water quality and availability
Mould cooling loops are sensitive to hardness and biological fouling. Where make-up water exceeds roughly 200 ppm hardness, scale forms in the mould cooling channels and raises effective mould temperature by 3 to 8 °C, which lengthens cycle time and degrades base clearance. Softening and a closed-loop design with a glycol secondary circuit resolve this. In water-scarce regions, closed-loop design also reduces make-up demand from 3.0 L to below 0.8 L per 1,000 bottles.
Certification and market access
Equipment and product certification requirements differ by destination and directly influence how quickly a plant can begin commercial supply. CE marking under the Machinery Directive is required for the European market, ISO 9001 quality system certification is expected by most multinational fillers, FDA food contact compliance governs resin and contact surfaces for the United States, and GB 4806 series requirements apply in China. A plant that starts certification documentation during machine manufacture rather than after commissioning typically begins commercial supply two to four months earlier, which directly shortens the payback clock.
Factor Ten: Downstream Integration, CIP and Aseptic Filling
Whether the blow line stands alone or feeds a filler changes the payback structure more than almost any machine specification, because integration removes bottle handling, storage, and the associated damage and contamination losses.
A standalone blow plant produces bottles, bags or boxes them, stores them, and ships them. Bottle handling adds 0.5 to 1.5 percent damage, requires significant warehouse volume because empty PET bottles are extremely low density, and introduces dust contamination that must be removed by rinsing before filling. An integrated blow-fill-cap block eliminates all three. Air conveying from blower to filler with an enclosed neck-handling track means the bottle never touches an operator or a floor, and the rinser can often be reduced to an ionised air rinser rather than a water rinser, cutting water use by 1 to 2 L per 1,000 bottles.
YuDa’s bottle blow-filling-capping (BFC) machine and linear blowing-filling-capping combiblock target this integration directly, producing the bottle and filling and capping it within one compact footprint. For small and mid-size water plants, this is frequently the shortest-payback configuration available because it collapses three asset groups into one and eliminates the empty-bottle warehouse entirely.
Where the product requires extended shelf life without preservatives, the downstream requirement escalates to clean or aseptic filling. Clean-in-place cycles typically use 2 to 4 percent caustic at 60 to 80 °C followed by 1 to 2 percent acid, with a full cycle taking 45 to 90 minutes. Aseptic filling adds bottle sterilisation with hydrogen peroxide or peracetic acid to achieve at least a six-log reduction, plus a sterile air zone at positive pressure. The asset base rises sharply, so aseptic lines only reach competitive payback at high utilisation and with product formats that genuinely require the technology. For standard still water and carbonated drinks, clean filling with correct rinsing is the faster-payback choice.
Integration also disciplines the blow line. When the filler is downstream, bottle dimensional consistency, neck ovality, and base stability become immediately visible as filler stoppages rather than as warehouse complaints. Plants report that integrated lines typically hold tighter blow process control simply because feedback is instantaneous.
Sensitivity Analysis: Ranking the Factors
Sensitivity analysis converts qualitative factor discussion into a ranked list of engineering priorities. The table below expresses, for a reference 8-cavity high-speed line producing 500 mL still water bottles at 70 percent OEE with a baseline payback of 24 months, how much each factor shifts the payback period when varied within realistic bounds.
| Factor varied | Change applied | Payback shift, months | Rank | Difficulty to change |
|---|---|---|---|---|
| OEE | 70% to 80% | -4.5 to -6.5 | 1 | Medium |
| OEE | 70% to 58% | +6.0 to +9.5 | 1 | Medium |
| Preform weight | 12.0 g to 9.5 g | -3.5 to -6.0 | 2 | Medium |
| Scheduled hours | 2 shifts to 3 shifts | -4.0 to -5.5 | 3 | Low |
| Specific energy | 16 to 12 kWh / 1,000 | -1.8 to -3.2 | 4 | Medium |
| Air recovery retrofit | 0% to 40% recovery | -1.5 to -3.0 | 5 | Low |
| Changeover time | 120 to 45 minutes | -2.0 to -4.0 | 6 | Low |
| Good-bottle yield | 96.5% to 99.0% | -1.5 to -2.5 | 7 | Medium |
| MTBF | 150 h to 280 h | -1.5 to -3.0 | 8 | Medium |
| Cavity over-specification | 8 to 12 cavities at same demand | +3.0 to +7.0 | 9 | Design stage only |
| Labour coverage | 10 to 4 operator-hours / shift | -0.8 to -2.2 | 10 | Medium |
| Ambient design margin | 35 °C to 45 °C chiller rating | -0.5 to -2.0 in hot climates | 11 | Design stage only |
| Certification lead time | Parallel vs sequential | -2.0 to -4.0 | 12 | Low |
Two patterns emerge. First, the highest-ranked levers are operational rather than capital: utilisation, material efficiency, and scheduling outrank every equipment feature. Second, several of the most valuable levers carry low difficulty, notably shift pattern, changeover discipline, air recovery retrofit, and parallel certification. A plant that executes only the low-difficulty items in this table typically removes 6 to 12 months from its payback period without changing a single major asset.
The negative entries are equally instructive. Cavity over-specification adds three to seven months and cannot be corrected after purchase, which makes correct sizing at the specification stage more valuable than any subsequent optimisation.
Payback Benchmarks by Factory Archetype
Global PET bottle factories fall into a small number of recognisable archetypes, each with a characteristic payback band. Identifying which archetype a project belongs to is the fastest way to set realistic expectations before detailed modelling begins.
| Archetype | Typical line | Utilisation | Typical OEE | Payback band, months | Dominant risk |
|---|---|---|---|---|---|
| Entry trade bottler | Semi-auto 2 cavity, 1 shift | 25–40% | 45–58% | 30–48 | Demand volatility |
| Regional water plant | Full auto 4–6 cavity, 2 shifts | 50–65% | 62–74% | 20–32 | Changeover losses |
| Captive filler, still water | FGX 6–8 cavity combiblock, 3 shifts | 70–85% | 76–86% | 14–22 | Utility reliability |
| Carbonated soft drink co-packer | FGX 8–12 cavity, 3 shifts | 65–80% | 72–82% | 16–26 | Heavier preform burden |
| Edible oil and household chemical | Full auto 4–8 cavity, 2–3 shifts | 55–75% | 66–78% | 18–30 | Multi-SKU complexity |
| Hot-fill juice and tea | Heat-set 6–10 cavity, 3 shifts | 60–75% | 68–78% | 22–34 | Heat-set energy and mould cost |
| Pharmaceutical and cosmetic | One-step ISBM, 2 shifts | 45–65% | 60–72% | 24–40 | Validation and qualification time |
| 5 L jar and bulk water | Dedicated large-format, 2 shifts | 45–60% | 58–70% | 24–36 | Low cycle rate, high resin mass |
Two observations are worth drawing out. The captive filler archetype consistently achieves the shortest payback because it eliminates the empty-bottle logistics chain and runs near-continuous production against known internal demand. Conversely, the entry trade bottler archetype has both the smallest asset base and the longest payback, because low utilisation dominates every other advantage. Investors frequently assume that a smaller machine means a faster return; the data says the opposite unless utilisation is secured first.
The hot-fill archetype merits a note. Heat-set moulds operate at 120 to 145 °C rather than 10 to 15 °C, which reverses the thermal logic of the line and raises specific energy by 35 to 60 percent. The resulting container withstands filling at 85 to 92 °C and achieves wall crystallinity of 28 to 35 percent through thermal crystallisation on top of strain-induced crystallisation. The technology is essential for certain products but should never be specified where cold aseptic or clean filling would serve, because the payback penalty is substantial.
A Practical Roadmap to Shorten Payback
The factors above translate into a sequenced roadmap. The order matters, because early-stage decisions constrain what later optimisation can achieve.
Stage one: specification, before purchase
- Size cavity count so that projected year-two demand equals 70 to 80 percent of realistic sustained output, not 100 percent of nameplate.
- Group planned SKUs by neck finish and confirm that the machine supports the whole family without star wheel changes.
- Specify the energy-saving oven architecture, including reduced heater distance, ceramic reflectors, individual lamp layer trim, and neck cooling air knife.
- Specify high-pressure air recovery from the outset; retrofitting is possible but costlier in downtime.
- Rate the chiller for the actual site design ambient, not the catalogue standard, and oversize condenser area in hot climates.
- Confirm CE, ISO 9001, and destination-market food contact documentation will be issued with the machine, and begin certification workflows in parallel with manufacture.
- Order at least one spare mould cavity set and a defined wear part kit with the machine to avoid first-year availability losses.
Stage two: commissioning and ramp-up
- Run a structured 72-hour continuous production test at contract speed before acceptance, recording BPH, reject rate, specific energy, and specific air.
- Establish baseline specific consumption figures on day one so later drift is detectable.
- Train two operators per shift to full recipe-change competence, not just start and stop.
- Build the oven recipe library for all planned preform weights during commissioning while the supplier engineer is on site.
- Install energy sub-metering on oven, compressor, and chiller separately.
Stage three: steady-state optimisation
- Attack availability first: track top five stop reasons weekly and eliminate them in order.
- Run a staged lightweighting programme in 0.3 to 0.5 g increments with full top load and drop testing at each step.
- Trend specific air consumption monthly; a rising trend indicates valve seal leakage before it becomes a quality defect.
- Reorganise the production schedule around neck-finish families to cut changeover frequency and duration.
- Implement condition monitoring on the high-pressure compressor with discharge temperature and oil analysis trending.
- Review shift pattern annually; adding a third shift is often the fastest remaining payback lever once OEE exceeds 75 percent.
Frequently Asked Questions
What is a realistic payback period for a new PET bottle factory?
Across the global installed base, a well-utilised PET bottle plant typically reaches payback in roughly 18 to 36 months. Semi-automatic entry lines running one shift commonly sit at 30 to 48 months because utilisation is low. High-cavity automatic lines feeding a captive filling operation at above 80 percent utilisation compress payback to 14 to 22 months. Any projection below 12 months should be treated as optimistic unless the plant is replacing purchased bottles in an existing high-volume filling operation.
Which single factor moves PET bottle factory payback the most?
Capacity utilisation, expressed through OEE and scheduled hours, dominates every other variable. Moving OEE from 55 percent to 75 percent typically shortens payback by 8 to 14 months, and adding a third shift adds a further 4 to 5.5 months of improvement. Both changes spread a fixed asset base across substantially more qualifying bottles without proportional increases in input burden.
How many cavities should I buy for a start-up water plant?
Size for realistic year-two demand at 70 to 80 percent of sustained output. For most regional start-ups this means 4 to 6 cavities on a standard-speed full automatic machine, delivering 4,000 to 9,000 BPH. Jumping straight to 12 cavities is a common error that adds three to seven months to payback because the break-even utilisation for that configuration is around 70 percent, which a start-up rarely achieves in the first two years.
Does preform lightweighting really shorten the payback period?
Yes, substantially. Resin is the dominant share of per-bottle burden at typically 60 to 75 percent, so weight reduction has more leverage than any utility optimisation. Reducing a 500 mL still water preform from 12.5 g to 9.5 g is a 24 percent material reduction and commonly shortens payback by 3 to 7 months. The constraint is performance: top load, drop resistance, and dimensional stability must still pass specification, so reduce in small increments with full testing.
How much does high-pressure air recovery contribute?
Air recovery systems cascade 30 to 50 percent of exhausted blowing air into the pre-blow and low-pressure service circuits. Because compressed air represents 33 to 42 percent of specific energy on a typical line, this reduces total line energy by 10 to 18 percent, expressed as a cost index of 1.00 baseline versus 0.82 to 0.90 after recovery, and shortens payback by 1.5 to 4 months. It is one of the highest-return, lowest-difficulty items available.
Is two-step or one-step better for payback?
Two-step reheat stretch blow molding delivers faster payback for standard bottles above roughly 4,000 BPH, because per-cavity output is 1,200 to 3,000 BPH versus 250 to 600 BPH for one-step, and specific energy is markedly lower. One-step injection stretch blow molding pays back faster for low-volume, high-value, wide-mouth, cosmetic, or pharmaceutical containers where neck and gate quality and the absence of preform handling dominate the economics.
How does changeover time influence payback?
For a plant running 6 to 12 SKUs, changeover is often the second largest capacity loss after unplanned stops. Cutting a full format change from 120 minutes to 45 minutes through modular mould carriers, tool-less rail adjustment, and stored oven recipes typically adds 3 to 6 OEE points, worth roughly 2 to 4 months off payback. Grouping SKUs by neck finish so changes involve only body and bottom moulds is the cheapest route to this gain.
What specific energy figure should I write into the purchase specification?
For a 500 mL still water format on a modern high-speed line, specify total line energy at or below 14 kWh per 1,000 bottles measured at the plant boundary, including oven, high-pressure compressor, chiller, and machine drives. Best practice on a well-configured line with air recovery and a short heater distance oven is 10 to 13 kWh per 1,000 bottles. Also specify compressed air at or below 24 Nm³ per 1,000 bottles with recovery active.
How should ramp-up be modelled in the payback calculation?
Model month one at 40 to 60 percent of steady-state OEE, month three at 65 to 80 percent, and full steady-state from month five to eight. Skipping the ramp curve understates payback by two to four months. The ramp can be compressed by building the full oven recipe library during commissioning, training two operators per shift to recipe-change competence, and running a documented 72-hour continuous production test before acceptance.
Do certifications affect the payback clock?
They affect it through time to first commercial supply rather than through operating cost. CE marking for European market access, ISO 9001 quality system certification expected by multinational fillers, FDA food contact compliance for the United States, and the GB 4806 series in China all require documentation that can be prepared in parallel with machine manufacture. Plants that start this work during manufacture rather than after commissioning typically begin commercial supply two to four months earlier.
What role does climate play in payback for tropical installations?
Climate acts mainly through chiller capacity and compressed air dew point. A chiller rated for 35 °C ambient loses 12 to 20 percent of capacity at 45 °C, causing mould temperature drift and a 2 to 5 percentage point yield loss in hot months. Specifying a 45 °C design ambient and 20 to 30 percent additional condenser area, plus a pressure dew point of at least -20 °C on the high-pressure air circuit, removes both problems and protects 0.5 to 2 months of payback.
Is an integrated blow-fill-cap block always the faster payback choice?
For still water and similar non-carbonated products in small to mid-size plants, usually yes, because it eliminates the empty-bottle warehouse, removes 0.5 to 1.5 percent handling damage, and often allows an ionised air rinser instead of a water rinser. For plants supplying bottles to multiple external fillers, or where filling requires aseptic technology that a compact block cannot host, a standalone blow line remains the correct configuration.
Conclusion
Payback period in a global PET bottle factory is determined far less by which machine is purchased and far more by how that machine is sized, utilised, fed, and maintained. The sensitivity ranking is unambiguous: capacity utilisation and OEE lead, preform weight follows, then shift pattern, specific energy, air recovery, and changeover discipline. Machine features matter, but they matter because of how they enable those operational variables, not as independent virtues.
The practical implication for anyone specifying a line is to resist the two opposite temptations. Do not over-specify cavity count in the hope of future demand, because break-even utilisation rises with cavities and unused capacity adds three to seven months to payback. Equally, do not under-specify automation or energy features to reduce the initial asset base, because manual handling caps sustainable OEE and inefficient ovens and compressors impose a permanent burden that no operational discipline can remove.
Expressed without currency, the target profile for a competitive global PET bottle plant in 2026 is clear: sustained OEE above 78 percent, good-bottle yield above 99 percent, specific energy below 14 kWh per 1,000 bottles, compressed air below 24 Nm³ per 1,000 bottles with recovery active, format changeover under 50 minutes, MTBF above 250 hours, and a 500 mL still water preform at or below 9.5 g. A plant that hits that profile will land in the 15 to 24 month payback band regardless of region.
YuDa, a Wanplas factory with more than 20 years of PET blow molding experience, 20+ patents, and installations in over 60 countries, builds its semi-automatic, standard-speed full automatic, FGX high-speed, and blowing-filling-capping combiblock ranges around exactly these levers: a cam-linked mould movement that simplifies changeover, a 38.1 mm heater distance oven that cuts oven electricity by over 30 percent, modular construction for fast maintenance, and a remote monitoring system that shortens diagnostic response for plants far from a service base. Under the Wanplas brand commitment to warm global customers with China plastic machinery, the group supports projects from single-machine entry lines to fully integrated blow-fill-cap installations. For a project-specific payback assessment, the most useful information to prepare is your target bottle format and weight, planned SKU list with neck finishes, expected shift pattern, and site ambient conditions, since those four inputs determine most of the outcome.