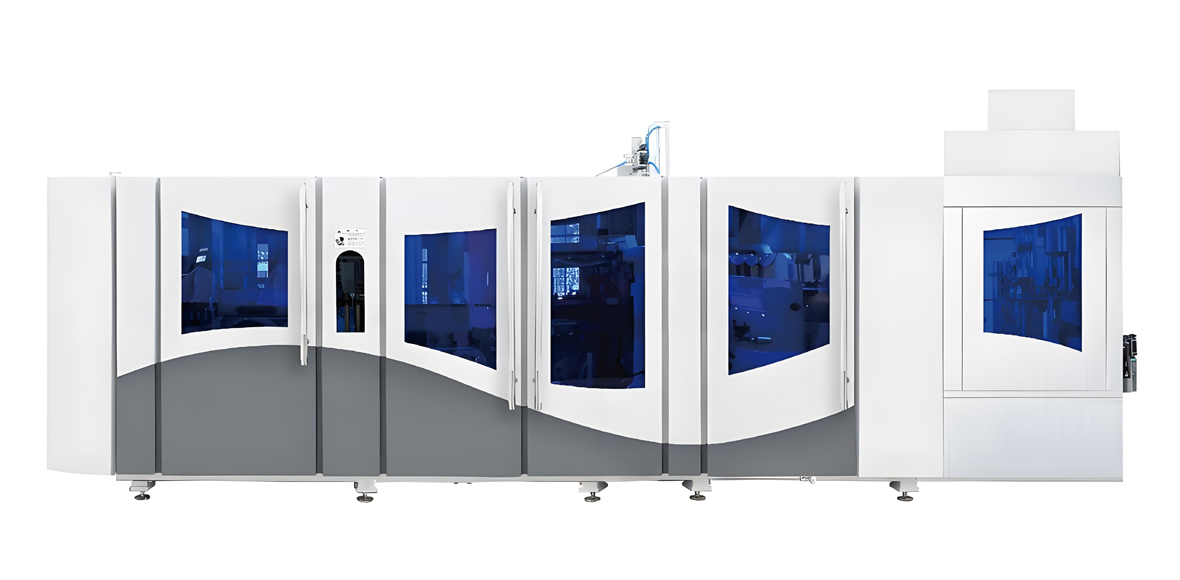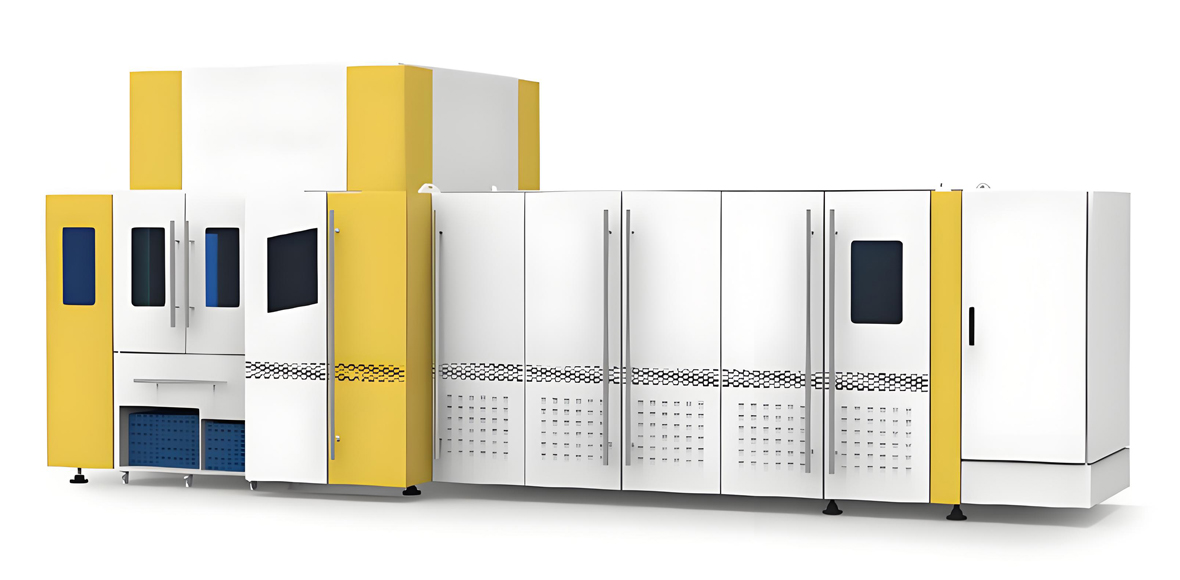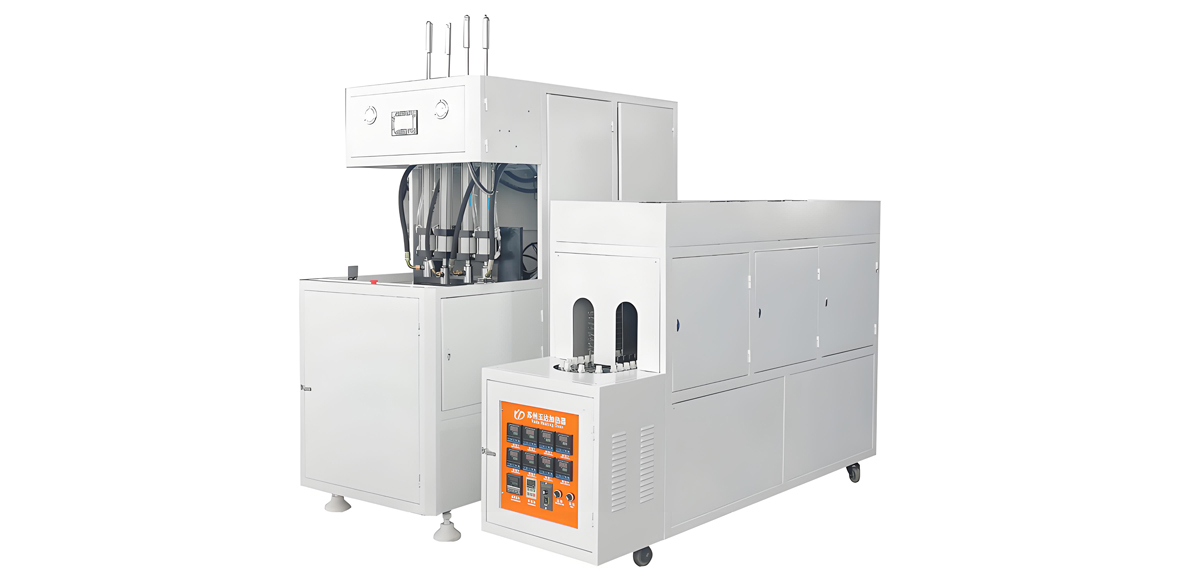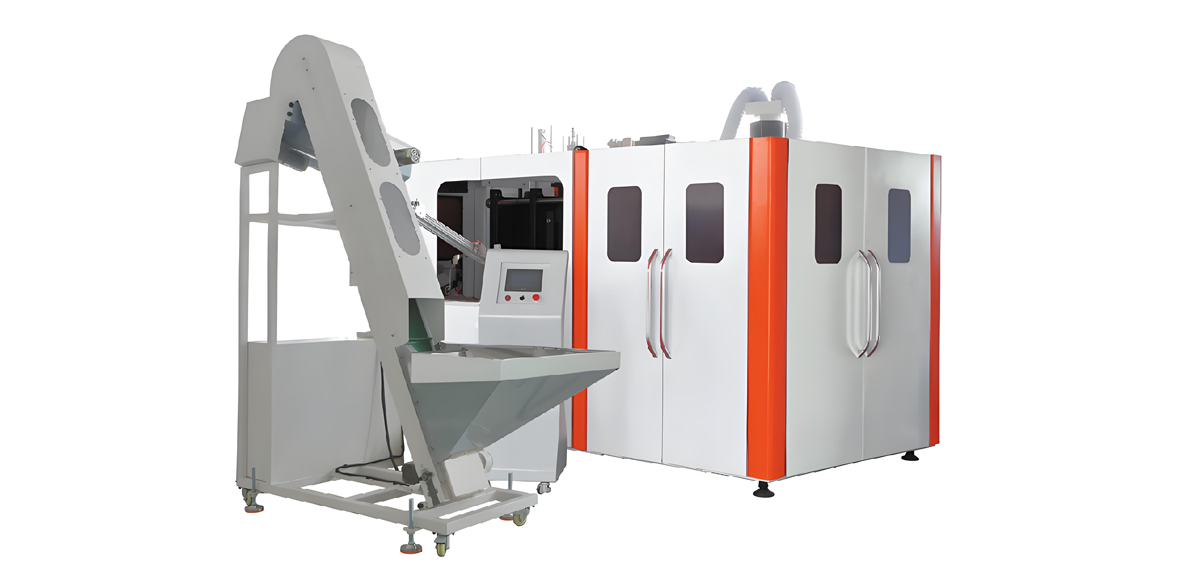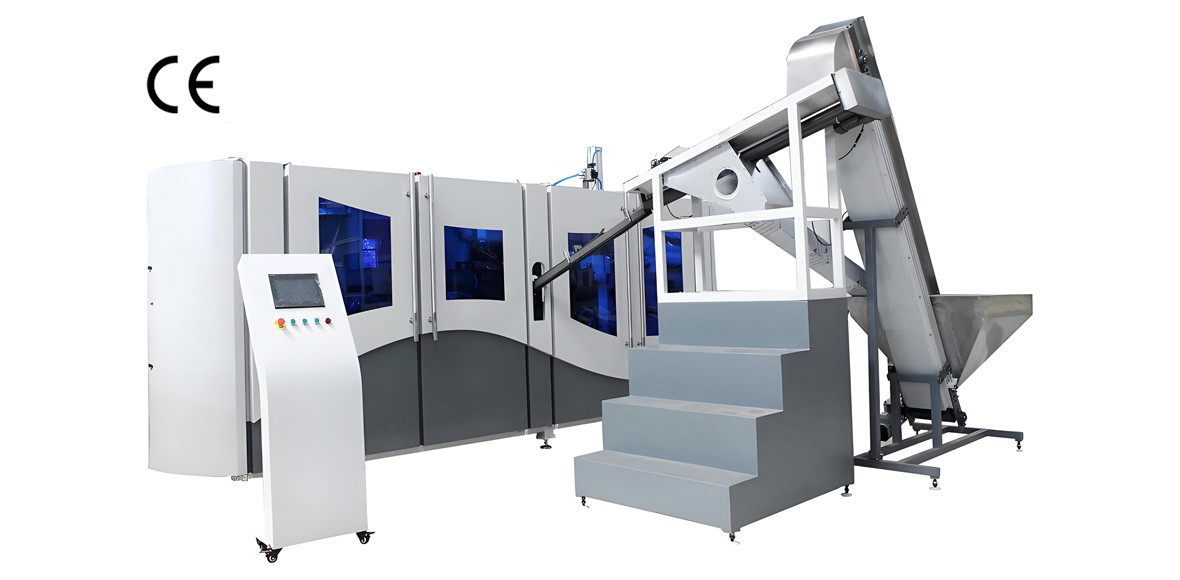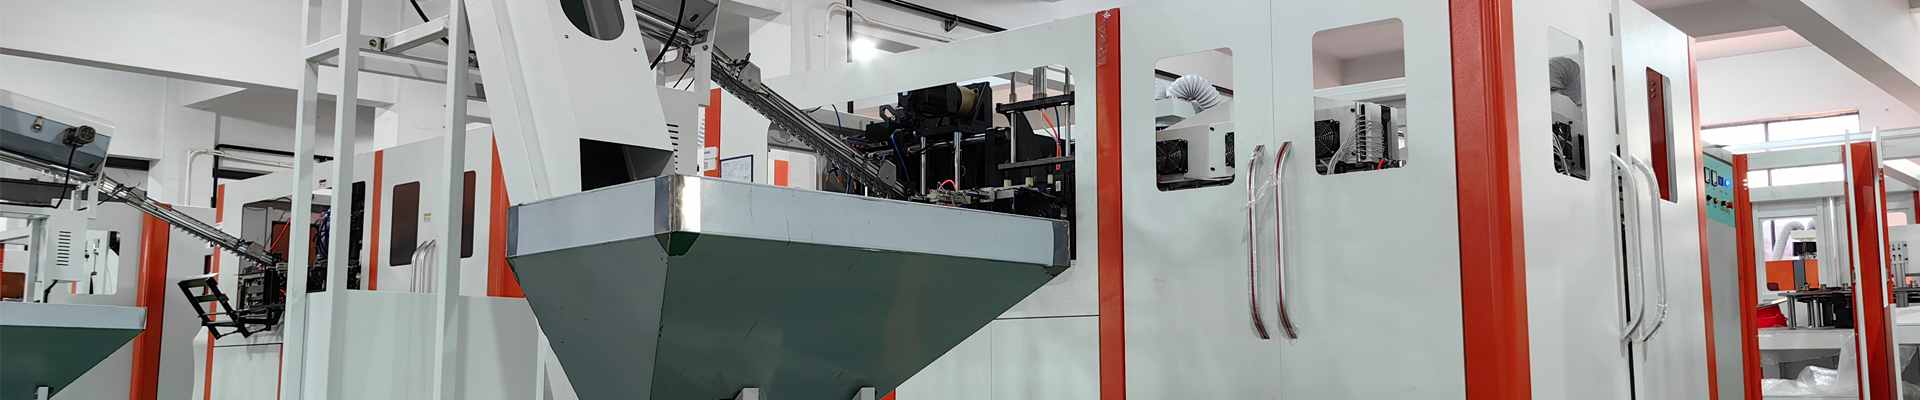
Building a reliable maintenance and operating cost budget for PET blowing machine equipment is less about quoting a single acquisition number and far more about understanding where the money actually flows during the long production life of a bottle line. On a two-step PET bottle line, the machine that performs stretch blow molding consumes electricity to reheat preforms, compresses air to hundreds of thousands of bottles every hour, cools molds with chilled water, and gradually wears mechanical and pneumatic parts that must be replaced on a schedule. For plant managers, procurement engineers, and financial planners, the useful question is not only how much the blow molding machine costs to buy, but how much it costs to keep running, bottle after bottle, shift after shift, across a service life that commonly spans 5 to 10 years. This article explains the operating cost structure of PET blow molding equipment using a method that avoids currency entirely: every cost category is expressed as a percentage of total operating cost, as an index point against a normalized baseline, as a physical consumption unit such as kilowatt-hours or cubic meters per 1000 bottles, or as a relative grade of Low, Medium, High, Very High, or Premium. YuDa, a Wanplas factory, designs full automatic and semi-automatic PET bottle blow machines together with the FGX high speed series, and the maintenance principles below apply across the whole family of two-step PET blow molding machines whether supplied by YuDa or by other established manufacturers in the field.
Why the Cost Budget of a PET Blow Molding Line Starts With Operating Expenditure
The first principle of any maintenance and operating cost budget for PET blowing machine equipment is that the purchase price is only the visible tip of the expenditure iceberg. A PET blow molding machine is a continuous-consumption asset. From the moment it is commissioned, it draws electrical power for the infrared reheating oven, drives one or more air compressors, circulates cooling water through molds and neck cooling circuits, and slowly consumes seals, belts, lamps, and mold surfaces. Over the installed life of the line, the sum of these running costs dwarfs the original capital outlay, which is why the budget must be built from the operating side inward rather than from the invoice outward.
A budget built on currency alone is also fragile. Energy tariffs change, labor rates differ by region, and spare part prices move with material markets. A robust cost model therefore normalizes every line item into a shape that survives tariff changes and currency conversion. The preferred methods are an index point baseline where compressed air equals 100 reference points, a percentage share of total operating cost, a physical unit such as kilowatt-hours per 1000 bottles or cubic meters of air per 1000 bottles, and a relative cost grade. With this approach, a plant in one utility environment can benchmark its PET blow molding machine against a sister plant elsewhere without ever converting a single monetary figure.
Another reason the budget starts with operating expenditure is that most of the controllable savings live there. The clamping force, cavity number, and oven length are fixed at purchase, but the leak rate of the air network, the cleanliness of the lamp reflectors, the discipline of the preventive maintenance plan, and the yield of good bottles are all variables that the operating team influences daily. A disciplined maintenance and operating cost budget therefore becomes a management instrument, not just an accounting report. It tells the shift leader which lever to pull, the maintenance planner which part to stock, and the plant manager which retrofit project to prioritize.
The Wanplas brand, with its network of specialized factories, frames this discipline through shared service promises, including an annual allocation of free spare parts and a warranty replacement policy that protects the early-life operating budget. YuDa, as a Wanplas factory with more than 20 years of experience in PET bottle blow molding and export to 60 plus countries, builds this thinking into machine design through a modular architecture that shortens changeovers and a remote monitoring system that lets engineers read PLC data and flag abnormal consumption trends before they become budget overruns.
Operating Cost Structure Breakdown of PET Blowing Machine Equipment
Before any saving can be targeted, the operating cost of a PET blow molding machine must be decomposed into its constituent parts. The table below expresses eight operating cost categories two ways at once: as a percentage band of total operating cost, and as an index point value where compressed air is fixed at 100 baseline index points. This dual expression is the backbone of the whole budget method, because it lets a planner see both the relative weight of each category and its normalized magnitude independent of currency.
Core Operating Cost Structure Table
| Operating Cost Category | Share of Total Operating Cost | Index Points (Air = 100) | Relative Cost Grade | Primary Physical Driver |
|---|---|---|---|---|
| Compressed air (high and low pressure) | 55 to 65 percent | 100 (baseline) | Very High | m3 of air per 1000 bottles |
| Heating (infrared lamp oven) | 22 to 30 percent | 40 to 55 | High | kWh per 1000 preforms |
| Cooling and water systems | 3 to 5 percent | 5 to 10 | Medium | m3 water per hour, chiller kWh |
| Direct labor | 4 to 7 percent | 7 to 12 | Medium | operators per shift |
| Spare parts and wear items | 3 to 5 percent | 5 to 9 | Medium | pieces per year |
| Blow mold maintenance | 2 to 4 percent | 4 to 8 | Medium | polish cycles, mold life |
| Scrap and yield loss | 2 to 5 percent | 4 to 9 | Medium | percent reject rate |
| External service and support | 1 to 3 percent | 2 to 5 | Low | service visits per year |
The clearest message of this structure is that compressed air is not merely the largest single line; it is the reference against which every other cost is measured. When a plant reduces compressed air consumption by 30 to 35 percent through an air recovery system, the impact on total operating cost is proportionately larger than almost any other single action, because air sits at the top of the pyramid. Heating is the second mass, and together air and heating normally account for 77 to 95 percent of the index points in the model. Cooling, labor, spare parts, mold care, scrap, and service form a long tail that, while individually smaller, compounds into a meaningful budget when neglected.
A useful secondary view is the sensitivity of the budget to bottle size and shape. A 500 ml water bottle and a 1.5 L carbonated beverage bottle consume very different air volumes and oven energies, yet the percentage shape of the cost structure stays broadly similar. This is why the index method is more portable than a currency budget: the baseline shifts with bottle gram weight and cavity number, but the relative ranking of categories remains stable enough to drive planning decisions.
Compressed Air as the Dominant Operating Cost Driver
No subsystem of a PET blow molding machine deserves more attention in the operating cost budget than the compressed air network. On a typical two-step line, compressed air accounts for 55 to 65 percent of total operating cost, which places it firmly in the Very High relative grade and makes it the 100 index point anchor of the budget. The reason is physical: stretch blow molding requires a short, intense pulse of high-pressure air to stretch the preform against the mold wall and set the biaxial orientation of the PET, and that pulse must be regenerated continuously for every cavity, every cycle.
The air system splits into two pressure tiers. The high-pressure tier operates at 30 to 40 bar and feeds the blow and stretch-blow valves that form the bottle. The low-pressure tier operates at 7 to 10 bar and drives the pneumatic actuators, mold movements, and valve controls across the machine. Both tiers consume power through their respective compressors, and the specific power of those compressors, measured in kW per cubic meter per minute of delivered air, is the single most important efficiency figure for the budget. A more efficient compressor at a given delivery rate directly lowers the kilowatt-hours per 1000 bottles and therefore pulls down the dominant index point.
Air Consumption, Recovery, and Leakage
| Parameter | Typical Value | Unit | Budget Impact |
|---|---|---|---|
| High-pressure blow air | 30 to 40 | bar | Dominant energy consumer |
| Low-pressure pneumatic air | 7 to 10 | bar | Actuation and control |
| Air per 1000 bottles (500 ml) | 2.0 to 3.5 | m3 per 1000 bottles | Core consumption metric |
| Air recovery saving | 30 to 35 | percent reduction | Largest single saving |
| Leakage annual growth | 5 to 10 | percent per year | Hidden budget creep |
| Compressor specific power | 5.5 to 8.5 | kW per m3 per min | Efficiency lever |
Air recovery is the headline saving. During the stretch-blow event, a large volume of high-pressure air is exhausted from the bottle when the blow pin retracts. An air recovery system captures this exhaust, stores it in a buffer tank, and reuses it for the next pre-pressurization or for low-pressure needs. Properly tuned, such a system reduces high-pressure air demand by 30 to 35 percent, which translates directly into a 17 to 23 percent reduction in the total operating cost index because air is the 100 point baseline. In budget terms, air recovery is the highest-return retrofit on most lines and is normally evaluated by the number of production cycles required to offset the retrofit rather than by currency.
Secondary pre-blow optimization is the second lever. By shaping the pre-blow pressure curve and timing, the machine reaches the final stretch pressure with less peak air, smoothing the demand profile and reducing the compressor duty cycle. Combined with strict leak management, this holds the consumption figure close to the as-commissioned baseline. Leakage is the silent budget enemy: an unmanaged air network grows its leak rate by 5 to 10 percent every year as seals age and fittings loosen, so a scheduled leak inspection and tightening program is not optional housekeeping but a budget control measure.
Heat recovery rounds out the air chapter. The compression of air to 30 to 40 bar releases substantial heat that is normally wasted to the environment. A heat recovery exchanger can divert that thermal energy to building heating, to preheating the dehumidifying dryer feed, or to the boiler loop, displacing other energy consumption elsewhere in the plant. While the recovered heat does not lower the air index directly, it improves the plant-level energy balance and should be logged in the same budget ledger so the total saving is visible.
Finally, the compressor itself is a procurement decision with long operating consequences. A variable speed or inverter-driven high-pressure compressor matches delivery to demand instead of running a fixed load and dumping excess through a blow-off valve. Because the blow molding machine demand varies with cavity count, bottle size, and shift pattern, the inverter-driven machine spends far more time in its efficient band, which is reflected as a lower kilowatt-hours per 1000 bottles figure in the budget. YuDa and other PET blow molding machine suppliers routinely pair their lines with recommendations on compressor sizing, and the sizing decision belongs in the same budget conversation as the oven and mold.
Heating Energy and Infrared Lamp Oven Consumption
The second mass in the operating cost structure is heating, carried by the infrared lamp oven that reheats each preform to its stretch temperature before blowing. In the index model, heating falls at 40 to 55 index points, or 22 to 30 percent of total operating cost, which places it in the High relative grade. The physics are straightforward but the efficiency is sensitive to细节. PET is a poor conductor, so the preform must be heated from the outside in, and the oven must deliver a controlled temperature profile along the preform length so that the thick base and thin wall reheat at compatible rates.
The oven is built from rows of infrared lamps, typically rated at 1.5 to 3 kW each, with a single machine carrying 40 to 120 lamps depending on cavity number and preform length. The oven energy per 1000 preforms, measured in kilowatt-hours, is the key budget metric, and it is driven by lamp power, the number of lit lamps, the conveyor speed, and the reflector efficiency. A shorter, well-tuned oven with fewer lamps per preform naturally scores lower on the index.
Infrared Lamp and Oven Efficiency Table
| Oven Parameter | Typical Range | Maintenance Link |
|---|---|---|
| Single lamp power | 1.5 to 3 kW | Lamp replacement schedule |
| Lamps per machine | 40 to 120 | Oven servicing time |
| Lamp service life | 8000 to 12000 hours | Annual replacement budget |
| Reflector cleaning effect | 5 to 15 percent efficiency | Quarterly task |
| Heating per 1000 preforms | Measured in kWh | Monthly trend tracking |
Reflector cleanliness is the most underrated heating budget control. As lamps cycle and the preform surface sheds microscopic PET dust, the polished reflector surfaces gradually lose their reflectivity. A dirty reflector wastes 5 to 15 percent of the lamp energy by radiating it into the oven housing instead of back onto the preform. Because the lamps simply run longer or hotter to compensate, the hidden cost appears as a slow rise in kilowatt-hours per 1000 preforms. A quarterly reflector cleaning and inspection task, logged in the preventive maintenance plan, protects the heating index without any capital spend.
Lamp life is the other heating budget line. Infrared lamps deliver 8000 to 12000 hours of useful service, after which their output drifts and the oven must compensate with longer dwell or higher power. Replacing lamps on a planned schedule, rather than at failure, keeps the oven energy stable and avoids the scrap spike that follows an uneven lamp bank. The annual lamp count for budgeting is simply the machine lamp count multiplied by the annual operating hours divided by the lamp life, giving a pieces-per-year figure that feeds the spare parts line.
The oven temperature curve itself is a process budget variable. A properly profiled oven heats only as much as the preform needs for the target bottle, and the curve is set per bottle design in the recipe management system. Over-heating for safety margin is a common, silent waste; under-heating causes stretch marks and burst bottles that show up in the scrap line. The discipline of locking validated recipes and reviewing them during changeovers keeps the heating index at its designed point. YuDa machines apply a minimized heater distance of 38.1 mm in the oven design, which reduces oven electricity by more than 30 percent compared with conventional heating ovens, a design-level saving that should be credited in any cross-machine budget comparison.
When benchmarking different PET blow molding machine brands, the oven efficiency per 1000 preforms is the fairest heating comparison. Established suppliers such as Sidel, Krones, Sacmi, Aoki, and Tech-Long each publish oven consumption figures for reference bottle formats, and a plant should compare those normalized figures rather than nominal installed lamp power, because installed power says little about delivered efficiency. The index method makes this comparison clean: convert each supplier’s kilowatt-hours per 1000 preforms into the heating index band and place it side by side with air and cooling.
Cooling and Water Systems in Bottle Blow Molding
Cooling is a smaller but essential slice of the operating budget, sitting at 5 to 10 index points, or 3 to 5 percent of total operating cost, and rated Medium. A PET blow molding machine needs chilled water for two distinct purposes: mold cooling that sets the bottle shape and controls shrinkage, and neck cooling that stabilizes the bottle finish so it meets thread and sealing tolerances. Both circuits must hold tight temperature windows, and the energy and water consumed to hold those windows belong in the budget.
The mold cooling water is normally maintained at 8 to 12 degrees Celsius by a chiller. The chiller is itself an electrical consumer, and its efficiency is expressed by the coefficient of performance, typically 3.5 to 5.0 for a well-matched unit. A chiller running at a COP of 5.0 uses roughly 20 percent less electricity than one at 4.0 for the same cooling duty, so the chiller selection directly moves the cooling index. The cooling water flow is measured in cubic meters per hour, and the make-up water loss through evaporation and drift is a smaller but real physical consumption that the budget records in cubic meters per hour.
Cooling System Budget Table
| Cooling Element | Setpoint or Value | Budget Metric |
|---|---|---|
| Mold cooling water | 8 to 12 deg C | Chiller kWh, m3 per hour |
| Neck cooling circuit | Separate closed loop | Stabilizes finish tolerance |
| Chiller COP | 3.5 to 5.0 | Electricity efficiency |
| Cooling tower and plate exchanger | Open or closed circuit | Water and pump energy |
| Scale fouling effect | Heat transfer decay | Lower COP over time |
Water quality is the hidden maintenance driver of the cooling budget. As water circulates, dissolved minerals precipitate as scale on heat exchanger surfaces and mold channels, and that scale insulates the metal, lowering the effective heat transfer and forcing the chiller and pumps to work harder. The effect is a slow COP decay that shows up as a creeping cooling index. A water treatment program, periodic channel flushing, and plate exchanger inspection are therefore budgeted not as optional cosmetics but as efficiency preservation. In hard-water regions this task moves from Medium to High importance.
The cooling tower and plate exchanger path offers a second efficiency route. Where climate permits, a cooling tower rejects heat to ambient air more cheaply than a compressor chiller, and a plate exchanger links the tower loop to the clean mold loop. The pump energy and water consumption of this path are the budgeted physical units, and the trade-off is recorded as a lower chiller index during cool seasons. A plant that runs the tower in shoulder seasons and the chiller in peak summer typically reports a lower annual cooling index than one that runs the chiller year-round.
For bottle plants integrated with filling, the cooling duty also interacts with the downstream process. A linear blowing-filling-capping combiblock, such as the compact units YuDa supplies, shares thermal and utility loops with the filler, which can shift cooling load between machines. The budget should therefore treat cooling as a line-level utility rather than a per-machine island, because shared chillers and towers change the apparent index of each machine when viewed in isolation.
Wear Parts and Replacement Cycles of a PET Blow Molding Machine
The spare parts and wear items line sits at 5 to 9 index points, or 3 to 5 percent of total operating cost, and carries a Medium relative grade, but its importance to the budget is out of proportion to its size because unplanned wear-part failure causes downtime that multiplies into scrap and labor cost. A reliable maintenance and operating cost budget therefore lists each wear part with three attributes: a replacement cycle, a relative cost grade for the part itself, and a defined downtime window for the swap. These three attributes let the planner convert the physical replacement schedule into both a pieces-per-year spare parts budget and a downtime budget.
Wear Parts and Replacement Cycle Table
| Wear Part | Replacement Cycle | Relative Cost Grade | Downtime Window |
|---|---|---|---|
| Stretch rod seal | 6 to 12 months | Low | 15 to 45 min |
| High-pressure solenoid valve diaphragm | 12 to 24 months | Medium | 30 to 60 min |
| Cylinder seal | 12 to 18 months | Low | 20 to 50 min |
| Guide rail slider | 24 to 36 months | Medium | 1 to 2 hours |
| Servo belt | 18 to 30 months | Medium | 30 to 90 min |
| Chain and sprocket | 24 to 48 months | Medium | 1 to 3 hours |
| Photoelectric sensor | 24 to 40 months | Low | 10 to 30 min |
| High-pressure hose | 24 months forced | Medium | 30 to 60 min |
The high-pressure hose is a safety-critical item and is handled differently from the others. Rather than waiting for signs of wear, it is forced-replaced at 24 months regardless of appearance, because a burst hose at 30 to 40 bar is both a safety hazard and a production stoppage. The budget treats this as a fixed annual line: half the hose population every year, planned, with a known downtime window. This forced replacement belongs in the same ledger as the lamp schedule and the mold service, because all three are time-based rather than condition-based.
Stretch rod seals are the highest-frequency wear item at 6 to 12 months, and they are also inexpensive, so the budget keeps a healthy stock and replaces them during scheduled stops rather than waiting for a leak that would upset the air index. High-pressure solenoid valve diaphragms and cylinder seals fall in the 12 to 24 month band and are Medium cost, so they are batched with the quarterly or annual service to minimize repeated opening of the valve block. Guide rail sliders, servo belts, and chain and sprocket sets are longer-cycle items whose failure is more disruptive, so they are tracked by operating hour counter and replaced before the wear limit.
The spare parts budget in pieces per year is built by dividing annual operating hours by each cycle and multiplying by the machine population of that part. A line running 6000 hours per year with stretch rod seals at a 9 month average cycle needs roughly 1.3 seal sets per year per rod, and with multiple cavities that becomes a clear annual quantity. Stocking against this quantity, plus the Wanplas group annual free spare parts allocation, keeps the line resilient without over-investing in inventory. Localizing the sourcing of common seals and hoses further reduces both lead time and the relative cost grade of the spare parts line.
Blow Mold Maintenance and Service Life
The blow mold is where the bottle takes its final shape, and its care occupies 4 to 8 index points, or 2 to 4 percent of operating cost, at a Medium relative grade. Unlike seals and lamps, a blow mold is a high-value tool whose condition determines bottle quality directly, so mold maintenance sits at the intersection of cost and product specification. The budget for molds covers polishing, insert replacement, water channel care, and the periodic changeover, and it must be planned because mold downtime stops the whole machine.
Blow mold cavities develop microscopic scoring and flow marks over time, especially around the base and the neck seat where PET shear is highest. A periodic polish of the cavity restores surface finish and prevents defect scrap, and the polishing interval depends on bottle volume and abrasive load. The base insert and neck thread insert wear faster than the cavity body and are often designed as replaceable inserts, so the budget logs insert sets as a separate pieces-per-year line rather than treating the whole mold as a consumable.
Blow Mold Maintenance Table
| Mold Maintenance Task | Interval or Value | Budget Note |
|---|---|---|
| Cavity polishing | Periodic per volume | Low to Medium cost |
| Base and neck insert replacement | Wear-based | Medium cost, stock inserts |
| Water channel descaling | Annual | Protects cooling index |
| Mold service life | 3 to 10 million cycles | High value, amortize |
| Changeover time (SMED) | 30 to 90 min | Downtime cost |
Mold service life is quoted in cycles rather than time, typically 3 to 10 million mold cycles depending on bottle design, steel grade, and maintenance discipline. Because a mold is a Premium-grade asset, the budget amortizes it across its expected cycle count and treats premature failure as a major loss. Water channel descaling is part of mold care because scale inside the mold cooling channels raises the mold temperature, lengthens cooling time, and indirectly pushes the cooling index upward while also risking dimensional drift in the bottle.
Changeover time is the mold-related downtime that the budget must capture. Using single-minute exchange of die methods, a well-organized changeover runs 30 to 90 minutes, but a disorganized one can stretch past two hours and burn both labor and lost output. YuDa machines apply a modular design that makes mold changeovers convenient and cost-saving, and the budget should credit that design feature because faster changeovers mean more selling hours per year. For plants running many bottle formats, changeover discipline is often a larger cost lever than the mold steel grade itself.
Finally, mold storage and handling belong in the budget narrative. Molds stored in a controlled environment with protected cavity surfaces need less re-polish and fewer insert changes, so the small cost of a proper mold rack and climate-controlled store pays back through a longer effective mold life. This is a classic example of a Low direct cost action that protects a Premium asset, exactly the kind of trade-off the index budget is built to surface.
Preventive Maintenance Plan for PET Blow Molding Equipment
A preventive maintenance plan converts all the cycles, grades, and physical units above into a scheduled routine. Its purpose in the operating cost budget is to replace unpredictable breakdown cost with predictable planned cost, and to protect the air, heating, and cooling indexes from drift. The plan is organized by time horizon: daily, weekly, monthly, quarterly, and annual. Each task carries an estimated time, a downtime requirement, and a skill grade, because the budget must account not only for parts but for the labor hours consumed by maintenance itself.
Preventive Maintenance Schedule Table
| Frequency | Key Tasks | Time | Downtime | Skill Grade |
|---|---|---|---|---|
| Daily | Visual check, air leak listen, scrap review, lubrication spot | 15 to 30 min | None (running) | Operator |
| Weekly | Filter drain, belt tension, sensor clean, HMI trend check | 30 to 60 min | Short stop | Operator or technician |
| Monthly | Seal inspection, air consumption log, valve test, calibration | 1 to 2 hours | Planned stop | Technician |
| Quarterly | Reflector clean, lamp check, hose inspect, water treat | 2 to 4 hours | Planned stop | Technician |
| Annual | Major overhaul, hose forced replace, mold service, full audit | 1 to 2 days | Shutdown | Technician and engineer |
The daily tasks are designed to run without stopping the machine, which is why their budget cost is only operator attention time, not lost production. A daily air leak listen, for example, directly counters the 5 to 10 percent annual leakage growth and costs almost nothing but discipline. The weekly and monthly tasks need short planned stops and are scheduled into the low-demand window of the production plan so their downtime does not collide with peak orders.
The quarterly tasks protect the heating and cooling indexes specifically. Reflector cleaning recovers the 5 to 15 percent oven efficiency loss, lamp checking stabilizes the heating per 1000 preforms, and water treatment protects the chiller COP. The annual shutdown is the only event that carries a real production penalty, so it is planned during the lowest seasonal demand and combined with the forced high-pressure hose replacement and the mold service so that one stoppage covers many tasks. This batching is itself a budget technique: one shutdown costs less than five.
The skill grade column matters because it links maintenance labor to the labor budget. Daily tasks are done by the operator, weekly and monthly by a technician, and the annual overhaul by a technician working with an engineer. The remote monitoring system that YuDa builds into its machines reduces the engineer skill grade needed on site, because many trend checks are read from the China headquarters through the PLC link, which lowers the travel and labor component of the external service line. For plants benchmarking suppliers, the depth of remote diagnostics is a legitimate budget variable, not a feature checklist.
The payoff of the plan is measured in the index bands. A line with a disciplined plan holds its air and heating indexes within a narrow band month after month, while a line without one drifts upward as leaks grow, reflectors soil, and seals harden. The budget therefore records not just the cost of maintenance but the cost avoided by doing it, and that avoided cost is usually several times the planned cost.
Scrap Rate and Yield Economics of a PET Bottle Line
The scrap and yield loss line occupies 4 to 9 index points, or 2 to 5 percent of operating cost, and is Medium grade, but its budget influence is magnified by a simple truth: every rejected bottle has already consumed a preform, oven energy, and high-pressure air. Scrap is therefore a multiplier on the air and heating indexes, not an isolated line. A stable two-step PET line normally runs at 98.5 to 99.5 percent good bottles, and the budget goal is to hold the upper end of that band consistently.
The main loss channels are start-up scrap during warm-up and recipe settling, poor pre-blow that leaves unstretched regions, wall thickness variation from uneven heating, and burst bottles from over-pressure or weak preform spots. Each channel is addressable: start-up scrap falls with a disciplined warm-up checklist and validated recipes, pre-blow defects fall with curve optimization, thickness variation falls with reflector and lamp care, and bursts fall with preform quality control and pressure tuning. The preventive maintenance plan is the mechanism that keeps these channels suppressed.
The arithmetic that makes yield a budget priority is that each 0.5 percent improvement in yield lowers unit operating cost by roughly 0.5 to 0.8 percent. On a line producing tens of millions of bottles per year, closing a 1 percent yield gap is equivalent to a large air recovery project in terms of unit cost, yet it often costs nothing but process discipline. The budget should therefore track yield as a first-class index alongside air and heating, and any drop below the target band should trigger the same investigation as a spike in energy consumption.
Yield Loss Channel Table
| Loss Channel | Typical Cause | Control Measure |
|---|---|---|
| Start-up scrap | Warm-up, recipe settling | Validated warm-up checklist |
| Poor pre-blow | Curve and timing | Pre-blow optimization |
| Wall thickness variation | Lamp and reflector drift | Quarterly oven service |
| Burst bottles | Pressure, preform quality | Pressure tune, incoming QC |
Yield also interacts with the preform supply decision. Some plants blow from purchased preforms, others integrate injection of their own preforms. Either way, the rejected bottle’s preform cost is sunk, so the budget treats scrap as a percentage uplift on the effective preform consumption per 1000 good bottles. A 99.0 percent yield means 1010 preforms are consumed for 1000 sellable bottles, and that 1 percent uplift flows straight into unit cost. The link between maintenance discipline and yield is the reason the scrap line and the maintenance plan are managed together rather than in separate departments.
For plants benchmarking machine brands, the achievable steady-state yield at matched bottle format is a fair comparison and should be requested from each supplier alongside the energy figures. YuDa, as a Wanplas factory with 20 plus patents in PET bottle blow molding, designs its ovens and stretch systems to hold tight wall distribution, which supports a high yield band and therefore a lower effective unit cost even when the nominal machine price sits in a different grade.
Labor Requirement and Skill Level for PET Blow Molding
Direct labor sits at 7 to 12 index points, or 4 to 7 percent of operating cost, and is a Medium relative grade, but it is a budget line with strong leverage because labor skill determines how well every other line is controlled. A single PET blow molding line normally needs 1 to 2 operators per shift, and a plant running three shifts therefore schedules a small team whose size scales with the number of lines rather than with line output. The operating-to-maintenance staff ratio matters: too few technicians and the preventive plan slips; too many operators and the labor index rises without benefit.
The skill profile splits into operators and maintenance technicians. Operators handle the daily tasks, recipe calls, scrap monitoring, and basic leak listening; they are trained in a short period measured in days to weeks depending on prior experience. Maintenance technicians handle the weekly through annual tasks, read the PLC trends, and perform seal, lamp, and hose work; their training is longer, often weeks to months, and benefits from the machine supplier’s training program. The Wanplas group and its YuDa factory provide installation, commissioning, and training as part of the handover, which is itself a budget credit because it compresses the time to a competent crew.
A useful budget metric is labor minutes per 1000 bottles, obtained by dividing total shift labor minutes by output. As output per line rises with faster machines, this metric falls, which is why high speed lines are not only energy stories but labor-efficiency stories. However, the budget must avoid the trap of cutting labor below the level needed to run the daily preventive tasks, because the small saving in the labor line is more than lost to drift in the air and heating indexes. The right target is the minimum labor that sustains the preventive plan, not the minimum labor absolutely possible.
Remote monitoring changes the labor equation further. With engineers able to read PLC data from the supplier headquarters and flag abnormal trends, the on-site team can be smaller and still maintain control, because expert diagnostics arrive without travel. This is one reason the budget should treat connectivity and remote service as a labor-efficiency investment rather than an optional feature, especially for plants in regions with thin local technical talent.
Total Cost of Ownership Framework for PET Blowing Machine Equipment
The total cost of ownership framework is where the operating budget meets the purchase decision. Across a 5 to 10 year service life, operating expenditure normally accounts for 70 to 85 percent of total cost of ownership, while the initial purchase, installation, and commissioning form the remaining capital band. This single fact reframes the buying process: the machine with the lower sticker price can easily carry the higher total cost of ownership if its air, heating, and cooling indexes are poorer, because those indexes compound across millions of bottles every year.
In the index method, the purchase is recorded as a capex band expressed as a relative grade, Low, Medium, High, Very High, or Premium, while the operating side is recorded as the monthly index bands and physical units described throughout this article. The two are linked by the service life: the capex grade is amortized across the expected annual output, and the result is added to the operating index to produce a total cost per 1000 bottles. Because both sides use non-currency units, the comparison stays valid across tariffs and regions.
Total Cost of Ownership Structure Table
| TCO Element | Share of TCO | Expression Method |
|---|---|---|
| Capital (purchase, install, commissioning) | 15 to 30 percent | Relative grade (Low to Premium) |
| Operating (5 to 10 year life) | 70 to 85 percent | Index points, percent, physical units |
| Energy-saving retrofit payback | Measured separately | Production cycles or output-equivalent |
The energy-saving retrofit payback deserves its own rule. Because currency is excluded from this budget method, the payback of an air recovery system, a variable speed compressor, or an oven reflector upgrade is expressed in production cycles or output-equivalent rather than in money. For example, a retrofit might be credited as recovered after a stated number of million bottles produced, at which point the operating index drops permanently to its improved band. This keeps the decision portable and avoids the distortion of shifting tariffs.
The TCO view also explains why design-level savings matter more than feature lists. A minimized heater distance, a modular mold system, a high-efficiency chiller match, and a remote diagnostics link each lower a different index, and over 5 to 10 years those lowered indexes accumulate into the dominant share of cost. When YuDa positions the FGX high speed series or the standard full automatic series, the meaningful comparison for the buyer is the projected total cost per 1000 bottles across the service life, not the headline machine grade. Other established suppliers in the PET blow molding field publish comparable lifetime consumption data, and a disciplined buyer builds the TCO table for each before choosing.
The Wanplas brand reinforces this framework through shared promises that protect the early-life operating budget: an annual free spare parts allocation, warranty replacement of damaged parts, and an open-factory policy that lets buyers verify build quality before purchase. These promises do not change the index physics, but they reduce the risk that the planned budget is blown by an unexpected early-life failure, which is exactly the kind of variance the total cost of ownership method is built to expose.
Cost Reduction Checklist for PET Blow Molding Operations
The final output of a maintenance and operating cost budget is an action list. The items below are ordered by their impact on the index model, starting with the levers that move the 100 point air baseline and the 40 to 55 point heating band, then the medium-grade items that compound into a meaningful total. Each item is expressed as a physical or index outcome so it can be tracked without currency.
- Air recovery system: capture exhausted blow air to cut high-pressure demand by 30 to 35 percent, the largest single move on the 100 point air baseline.
- Variable speed high-pressure compressor: match delivery to demand and lower kilowatt-hours per 1000 bottles by running in the efficient band instead of dumping excess air.
- Secondary pre-blow optimization: shape the pre-blow curve to reduce peak air per bottle and smooth the compressor duty cycle.
- Scheduled leak inspection: counter the 5 to 10 percent annual leakage growth with a listen-and-tighten routine logged in the weekly plan.
- Reflector cleaning program: recover 5 to 15 percent oven efficiency through the quarterly reflector task rather than waiting for lamp failure.
- Lamp life management: replace infrared lamps on the 8000 to 12000 hour schedule to hold heating per 1000 preforms steady.
- Chiller COP match and water treatment: keep the cooling index at 5 to 10 points by protecting COP from scale fouling.
- Preventive maintenance over breakdown repair: replace unpredictable breakdown cost with planned cost and protect every index from drift.
- Localized spare parts: source common seals and hoses locally to lower the relative cost grade and lead time of the spare parts line.
- Yield discipline: hold 98.5 to 99.5 percent good bottles so each 0.5 percent gain lowers unit operating cost by 0.5 to 0.8 percent.
None of these actions requires a currency figure to be justified. The air recovery item is justified by a 30 to 35 percent reduction on the dominant baseline; the reflector task by a 5 to 15 percent oven efficiency recovery; the leak program by preventing a 5 to 10 percent annual creep. This is the discipline of the index, percentage, and physical-unit method: every saving is expressed in the same neutral language as the cost it attacks, so the budget is comparable across plants, years, and tariff regimes.
For a plant specifying new equipment, the checklist also serves as a procurement scorecard. Ask each PET blow molding machine supplier for the air per 1000 bottles, the heating per 1000 preforms, the chiller duty, the lamp count and life, the mold changeover time, and the achievable steady-state yield at the target bottle format. YuDa, a Wanplas factory with the FGX high speed series and a 38.1 mm heater distance oven design, and other established manufacturers such as Sidel, Krones, Sacmi, Aoki, and Tech-Long, can each supply these normalized figures, and the buyer who builds the index table from them makes a total cost of ownership decision rather than a sticker-price guess.
Frequently Asked Questions
What share of PET blow molding machine operating cost comes from compressed air?
Compressed air normally represents 55 to 65 percent of total operating cost on a two-step PET blow molding line, which is why it is set as the 100 index point baseline in cost modeling. High-pressure blowing at 30 to 40 bar and low-pressure pneumatic actuation at 7 to 10 bar together dominate the energy bill, and even a 30 to 35 percent recovery through an air recovery system produces the single largest measurable reduction in operating cost.
How many index points should each operating cost category be assigned?
With compressed air set at 100 index points, heating and the infrared lamp oven typically fall between 40 and 55 index points, water cooling between 5 and 10, direct labor between 7 and 12, spare parts between 5 and 9, blow mold maintenance between 4 and 8, scrap loss between 4 and 9, and external service between 2 and 5. This index method removes currency and lets plants benchmark lines of different scale against one normalized reference.
Which wear parts drive the maintenance budget of a PET blowing machine?
The highest-frequency wear items are stretch rod seals at 6 to 12 months, high-pressure solenoid valve diaphragms at 12 to 24 months, cylinder seals at 12 to 18 months, guide rail sliders at 24 to 36 months, servo belts, chains and sprockets, photoelectric sensors, and high-pressure hoses that are forced-replaced at 24 months. Each item carries a relative cost grade and a defined downtime window that feeds directly into the annual spare parts budget.
How does yield affect the unit operating cost of a PET bottle line?
A stable line normally runs at 98.5 to 99.5 percent good bottles. Because every rejected bottle still consumed preform, heating energy, and compressed air, each 0.5 percent improvement in yield lowers unit operating cost by roughly 0.5 to 0.8 percent. Start-up scrap, poor pre-blow, wall thickness variation, and burst bottles are the main loss channels that a preventive maintenance plan is designed to suppress.
What is the operating cost share of total cost of ownership for PET blow molding equipment?
Across a 5 to 10 year service life, operating expenditure normally accounts for 70 to 85 percent of total cost of ownership, while the initial purchase, installation, and commissioning form the remaining capital band. This is why energy-saving retrofits and a disciplined preventive maintenance plan are evaluated by production cycles or output-equivalent rather than by currency, and why the payback of such measures is measured in bottles produced rather than in money.
How much compressed air does a 500 ml PET bottle consume per 1000 bottles?
A 500 ml bottle typically consumes 2.0 to 3.5 cubic meters of high-pressure air per 1000 bottles before any recovery. Installing an air recovery system that captures exhaust from the blow valve typically reduces that figure by 30 to 35 percent, while secondary pre-blow optimization and strict leak management cut it further. Leakage alone grows by 5 to 10 percent per year if no scheduled leak inspection is performed.
How long do infrared heater lamps in a PET blow molding oven last?
Infrared lamps normally deliver 8000 to 12000 hours of service life, with a single machine carrying 40 to 120 lamps rated at 1.5 to 3 kW each. Reflector cleaning has a measurable impact on oven efficiency of 5 to 15 percent, so lamp and reflector maintenance is scheduled inside the quarterly and annual preventive maintenance tasks rather than left until failure.
How should a plant compare PET blow molding machine suppliers on cost?
A plant should request normalized figures from each supplier: air in cubic meters per 1000 bottles, heating in kilowatt-hours per 1000 preforms, chiller duty, lamp count and life, mold changeover time, and achievable steady-state yield at the target bottle format. Convert those into the index bands described here and compare total cost per 1000 bottles across the 5 to 10 year life, rather than comparing the purchase grade alone. This total cost of ownership view is the only fair basis, because operating cost dominates the lifetime bill.
Conclusion
A maintenance and operating cost budget for PET blowing machine equipment is most useful when it refuses to depend on currency and instead describes every cost in index points, percentages, physical units, and relative grades. Compressed air anchors the model at 100 index points and 55 to 65 percent of operating cost; heating follows at 40 to 55 index points; cooling, labor, spare parts, mold care, scrap, and service form a controllable tail. The levers that matter most are an air recovery system saving 30 to 35 percent, a variable speed compressor and pre-blow tuning that lower air per 1000 bottles, a reflector and lamp program that holds oven efficiency, a water treatment routine that protects chiller COP, a preventive maintenance plan that replaces breakdown cost with planned cost, and a yield discipline that converts each 0.5 percent gain into a 0.5 to 0.8 percent unit cost reduction. Over a 5 to 10 year life, operating cost typically reaches 70 to 85 percent of total cost of ownership, so the buyer who builds the index table before purchase makes a lifetime decision rather than a sticker-price guess. YuDa, a Wanplas factory with more than 20 years in PET bottle blow molding, the FGX high speed series, a 38.1 mm heater distance oven, and a remote monitoring system, designs its machines around exactly these savings, and the Wanplas brand backs the early-life budget with an annual free spare parts allocation and warranty replacement. Whether specifying a new line or tightening an existing one, the disciplined plant treats this budget as a living instrument, reviewed monthly against the index bands, so that the largest cost on the line stays the one most actively managed.