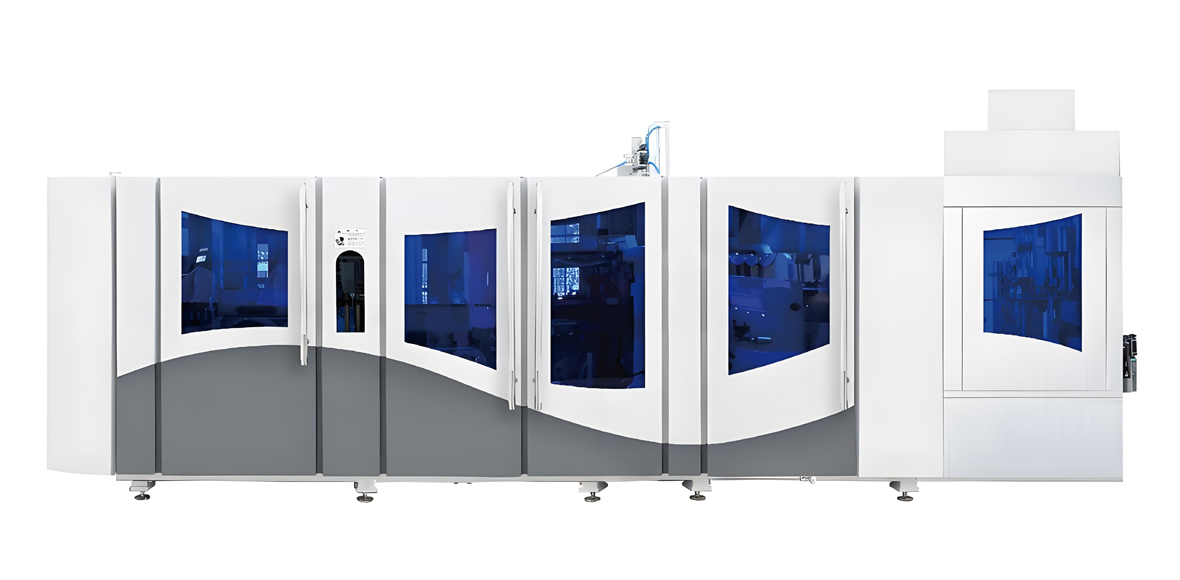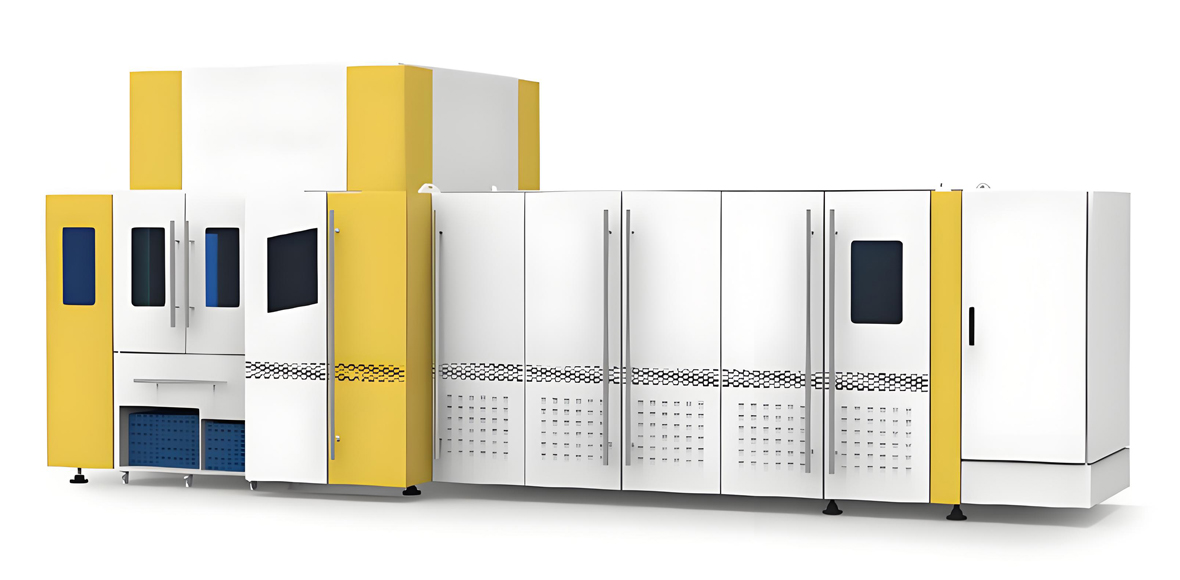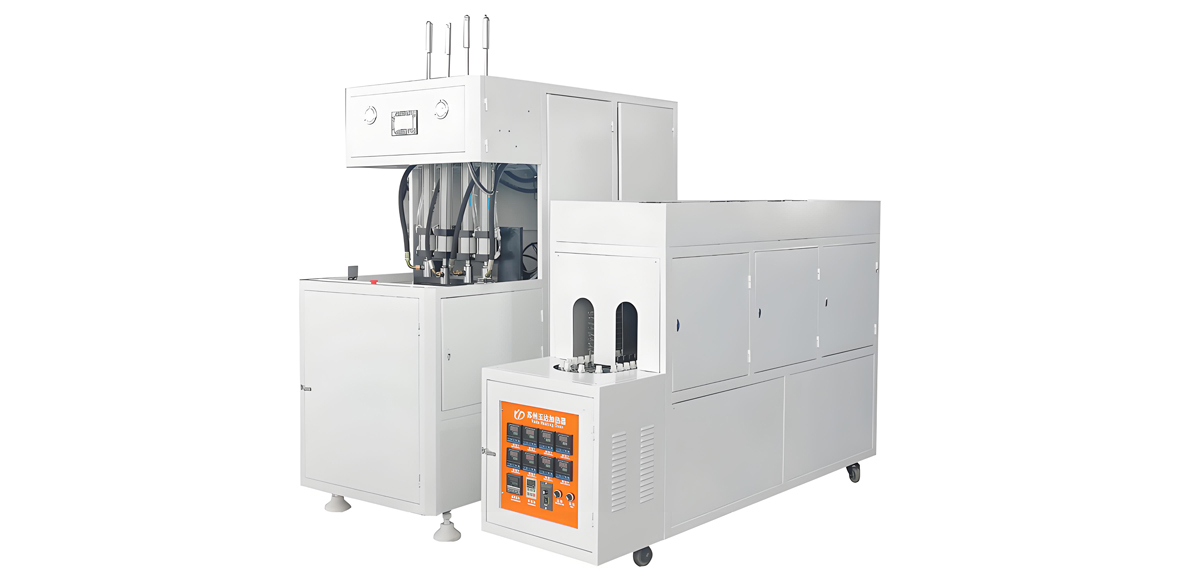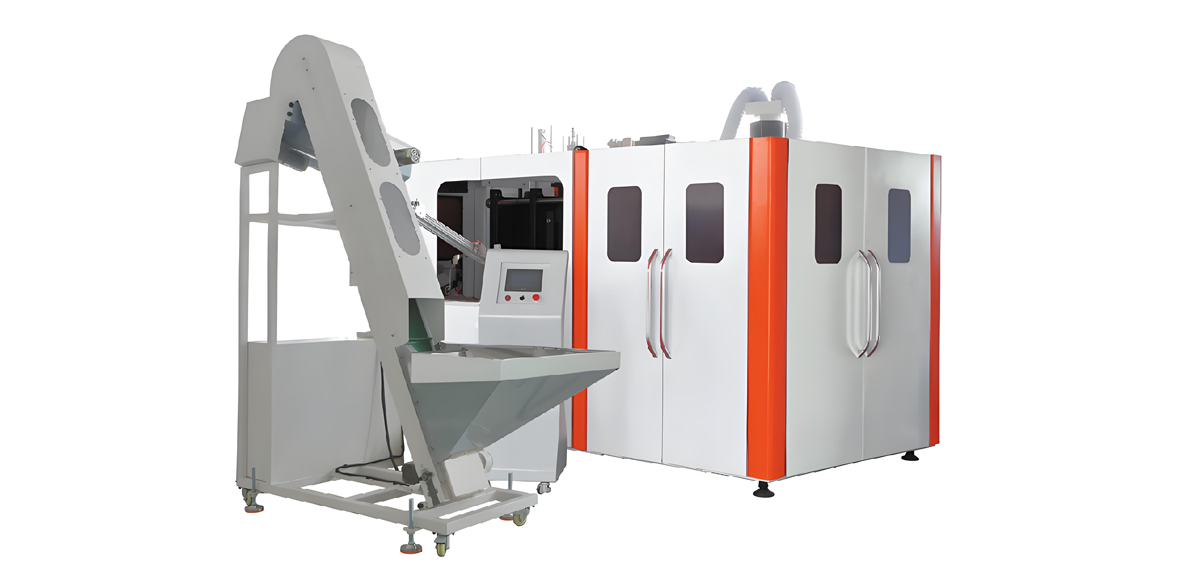
The operating cost of an automatic PET multi-cavity blowing machine is not a single number but a structured composition of eight distinct input streams, each governed by different physics and each responding to different engineering interventions. Buyers who evaluate machines only on nameplate output and purchase scope routinely discover, twelve months into production, that two lines with identical output ratings can differ by 30 to 40 percent in running burden. That gap is almost entirely explained by oven architecture, compressed air handling, cavity utilisation, and wear part discipline.
This article breaks that composition apart using physical and dimensionless measures rather than monetary figures. Consumption is expressed in kilowatt-hours per 1,000 bottles, normal cubic metres of compressed air per 1,000 bottles, litres of water per 1,000 bottles, grams of preform weight, operator-hours per shift, wear part life in cycles or hours, and scrap rate as a percentage. Where relative economics must be compared, a dimensionless cost index with a baseline of 1.00 is used. This keeps the analysis valid across every market where PET bottles are produced, unaffected by exchange rates, tariff structures, or resin market swings.
The technical frame of reference is the multi-cavity range of YuDa, a Wanplas factory specialising in PET bottle blow molding machines, with over 20 years of experience, 20+ patents, and exports to more than 60 countries. YuDa’s standard-speed full automatic series covers 1,000 to 7,000 BPH and its FGX high-speed series covers 8,000 to 15,000 BPH at 2,500 to 3,000 BPH per single mould station. Comparative reference is drawn from the wider global installed base including rotary platforms from Sidel and Krones and linear platforms from SIPA and other builders, so the ranges reflect real-world variation rather than one vendor’s specification sheet.
Defining Operating Cost for a Multi-Cavity PET Blowing Machine
Operating cost for a PET blowing machine is the total recurring input burden required to convert preforms into qualifying bottles, measured per 1,000 good bottles at the machine boundary. Defining the boundary correctly is the first and most frequently botched step in any cost analysis.
The correct boundary includes the blow machine itself, its infrared reheat oven, the preform feeding and orientation system, the high-pressure air compressor and its treatment train, the low-pressure service air supply, the chiller and mould cooling circuit, the bottle discharge conveying, and the operator coverage required to keep all of these running. It excludes the preform injection stage if preforms are purchased, and it excludes filling, labelling, and packing unless the machine is a combiblock.
A boundary drawn too narrowly around the blow machine alone omits the compressor and chiller, which together account for 45 to 60 percent of the line’s electrical demand. A boundary drawn too widely, encompassing filling and packing, hides the blow machine’s own performance behind downstream variability. The eight-bucket structure described below sits precisely at the correct boundary.
The denominator matters as much as the numerator. Operating cost must be expressed per qualifying bottle, not per bottle blown. A line producing 24,000 bottles per hour at 3.5 percent scrap yields 23,160 qualifying bottles, and every input consumed by the 840 rejected bottles has to be reallocated across the survivors. This is why scrap rate appears not as a separate small bucket but as a multiplier applied to the entire cost structure.
The Eight-Bucket Cost Composition Map
The operating cost of an automatic PET multi-cavity blowing machine divides cleanly into eight buckets, and their relative shares are remarkably stable across the global installed base for a given bottle format. Understanding these shares before attempting optimisation prevents the classic error of spending months on a bucket that represents four percent of the total.
| Bucket | Share of total | Primary physical driver | Controllability | Typical improvement available |
|---|---|---|---|---|
| Preform resin and material | 60–75% | Preform weight in grams | High at design stage | 15–25% via lightweighting |
| Electrical energy | 8–14% | kWh / 1,000 bottles | High | 20–40% |
| Compressed air | 4–8% | Nm³ / 1,000 bottles | High | 30–50% with recovery |
| Chilled water and cooling | 1.5–3% | Chiller kW and L / 1,000 bottles | Medium | 10–20% |
| Labour | 3–8% | Operator-hours / shift | Medium | 30–60% via automation |
| Wear parts and consumables | 2–4% | Component life in cycles or hours | Medium | 20–35% |
| Maintenance and downtime | 2–5% | MTBF hours, MTTR hours | High | 30–50% |
| Quality, compliance, overhead | 3–6% | Scrap %, test frequency | Medium | 15–30% |
Note that energy and compressed air are listed separately even though compressed air is produced by electricity. The separation is deliberate: it distinguishes the oven and machine drives, which are optimised through thermal and mechanical design, from the compressed air circuit, which is optimised through pressure management, dead volume reduction, and recovery. Combining them obscures which lever to pull. When considering only the utility sub-total, air typically represents 33 to 42 percent of the line’s total electrical demand and the oven 32 to 40 percent.
The shares shift predictably with format. Heavier containers such as 2 L carbonated bottles push resin share toward 78 percent and compress every other bucket. Very light containers such as 330 mL water bottles pull resin down toward 58 percent and raise the relative weight of energy and labour. Hot-fill and heat-set formats raise energy share to 16 to 22 percent because the moulds are heated to 120 to 145 °C rather than chilled to 10 to 15 °C.
Bucket One: Preform Resin and Material Conversion
Preform resin is the dominant share of per-bottle operating cost at typically 60 to 75 percent, which makes preform weight the highest-leverage variable in the entire cost structure. No optimisation elsewhere approaches its magnitude.
The physical driver is simple: a bottle weighs what its preform weighed, minus a negligible flash allowance. A 500 mL still water bottle produced from a 12.5 g preform consumes 31 percent more resin than one produced from a 9.5 g preform. Applied across the resin bucket, that difference alone moves the total operating cost index by roughly 19 to 23 percent.
Where lightweighting limits lie
Lightweighting is bounded by the biaxial orientation physics of PET. In the blow mould the preform is stretched axially by the stretch rod at 1.0 to 1.6 m/s and radially by air pressure, producing an axial stretch ratio of 2.5 to 3.2 and a hoop stretch ratio of 3.5 to 4.5. The product of the two, the planar stretch ratio, must land between roughly 10 and 16 for correct strain-induced crystallisation. Within that window, wall crystallinity reaches about 20 to 25 percent, giving the bottle stiffness, clarity, creep resistance, and barrier performance.
Push the planar ratio above roughly 18 by removing too much material and the wall thins locally, producing pearling, stress whitening, and unpredictable top load. Fall below roughly 8 and orientation is insufficient, so the bottle creeps under load and loses dimensional stability over shelf life. Every gram removed must therefore be validated against top load, drop impact at fill temperature, burst pressure for carbonated formats, and 24-hour dimensional stability.
Resin grade and intrinsic viscosity
Intrinsic viscosity determines melt strength and the process window. Still water formats run at 0.76 to 0.82 dL/g, carbonated formats at 0.80 to 0.86 dL/g for burst and creep resistance under internal pressure, and hot-fill formats at 0.74 to 0.78 dL/g because heat-set processing tolerates lower molecular weight. Using a higher IV than needed raises drying and processing energy without benefit; using a lower IV than needed produces field failures that no process adjustment can fix.
Moisture control matters because PET hydrolyses at melt temperature. Preforms must be injected from resin dried below 50 ppm moisture, typically 4 to 6 hours at 160 to 170 °C in a desiccant dryer with a dew point of -40 °C. Plants buying preforms rather than injecting them should specify acetaldehyde content below roughly 8 ppm for water applications, wall thickness variation below 0.15 mm, and gate crystallinity free of visible haze.
Recycled content
Food-grade recycled PET is now standard in many markets at 25 to 100 percent inclusion. Recycled material typically arrives with lower and more variable intrinsic viscosity, higher acetaldehyde, and occasional black speck contamination. Processing adjustments include raising oven body temperature by 2 to 5 °C to compensate for altered infrared absorption caused by residual colour, tightening preform inspection, and widening the pre-blow pressure window. Well-managed lines run 50 percent recycled content with no measurable scrap penalty; poorly managed ones see scrap rise 1 to 3 percentage points.
Bucket Two: Electrical Energy in the Infrared Reheat Oven
Electrical energy is the largest controllable operating cost bucket after resin, typically 8 to 14 percent of the total and 30 to 38 percent of the non-resin burden. Within that bucket, the infrared reheat oven consumes 32 to 40 percent of line electricity, making it the single richest target for engineering improvement.
The oven’s job is thermally precise. It must raise the preform body from ambient to 95 to 115 °C, comfortably above the PET glass transition of about 78 to 80 °C but well below the cold crystallisation onset around 120 to 140 °C where the material would turn hazy and lose blowability. Simultaneously it must keep the neck finish below roughly 70 °C so the thread geometry and support ring stay dimensionally stable, since any neck distortion causes capping failures downstream.
Oven architecture and its energy consequences
A typical oven contains six to twelve vertical layers of quartz infrared lamps rated at 2,000 to 3,000 W each, with preforms rotating at 40 to 80 rpm as they traverse the tunnel so that circumferential absorption is uniform. PET absorbs efficiently in the near-infrared band around 1.0 to 1.6 μm, so lamp spectral output must be matched to that window; lamps running at lower filament temperature shift toward longer wavelengths that PET absorbs less efficiently, wasting energy as convective heat in the tunnel.
The dominant loss mechanism is radiative escape. Energy that misses the preform strikes the reflector or the tunnel wall and is largely lost. This is why lamp-to-preform distance is the critical design dimension. YuDa’s energy-saving oven minimises heater distance to 38.1 mm, which raises the geometric view factor between lamp and preform substantially. In field comparison against conventional heating ovens, this configuration saves over 30 percent of oven electricity for equivalent preform temperature profiles.
| Measure | Mechanism | Typical oven energy saving | Effect on cycle | Retrofit difficulty |
|---|---|---|---|---|
| Reduced heater distance to 38.1 mm | Higher radiative view factor | 25–35% | Neutral to faster | Design stage |
| Ceramic back reflectors | Returns escaped radiation | 6–12% | Neutral | Low |
| Individual lamp layer power trim | Matches profile to preform geometry | 5–10% | Improves wall distribution | Low |
| Pyrometer closed-loop control | Eliminates thermal overshoot margin | 4–9% | Faster stabilisation | Medium |
| Neck cooling air knife | Allows higher body temperature safely | 3–7% | Reduces neck defects | Low |
| Preform pitch matching | No lamp radiating into gaps | 3–8% | Neutral | Medium |
| Tunnel insulation upgrade | Reduces convective loss | 2–5% | Neutral | Low |
| Lamp replacement at end of life | Restores spectral output | 3–8% | Restores stability | Low |
Machine drives and ancillaries
Beyond the oven, the machine’s own servo drives, cam mechanisms, and clamping consume 6 to 10 percent of line electricity. YuDa’s cam-linking system integrates mould opening, mould locking, and bottom mould elevation into a single coordinated movement driven by a high-speed servo system, which reduces both the number of actuators and the peak power draw compared with architectures using separate hydraulic or pneumatic circuits for each function. Fewer independent actuators also means fewer air consumers and fewer wear points.
Conveying, air treatment, dryers, and lighting make up the residual 4 to 8 percent. These are rarely worth optimising individually but are worth sub-metering, because an unexpected rise in this category is often the first symptom of a compressed air leak elsewhere in the plant.
Bucket Three: Compressed Air and High-Pressure Recovery
Compressed air is the most technically interesting operating cost bucket because its consumption is set by geometry rather than by thermodynamics, which means it responds dramatically to mechanical design changes. It represents 4 to 8 percent of total operating cost and 33 to 42 percent of line electrical demand.
PET stretch blow molding uses two air circuits. The pre-blow circuit operates at 6 to 12 bar and inflates the preform gently while the stretch rod is descending, controlling material distribution along the bottle axis. The high-pressure blow circuit operates at 25 to 40 bar and forces the material into full contact with the mould surface, defining the final geometry, base detail, and surface finish. Still water formats typically use 25 to 32 bar; carbonated formats need 32 to 40 bar to reproduce petaloid base detail and achieve the required wall orientation.
Where the air actually goes
For a 500 mL bottle blown at 32 bar, the geometric air requirement is approximately 16 NL per bottle. Actual consumption is far higher because the valve block, blow nozzle, and connecting manifold contain dead volume that is pressurised and then exhausted on every cycle. That dead volume typically adds 60 to 130 percent, giving 26 to 38 Nm³ per 1,000 bottles on machines without recovery.
Two design decisions dominate this figure. First, mounting the blow valve block as close as physically possible to the nozzle shortens the pressurised dead volume. Second, sizing the nozzle bore to the actual flow requirement rather than oversizing it reduces both dead volume and exhaust losses. Together these can cut specific air by 15 to 25 percent before any recovery system is considered.
High-pressure air recovery
Air recovery is the highest-value energy measure available on a PET blow line. Instead of venting exhaust air to atmosphere when the mould opens, the system cascades it into the pre-blow circuit and then into the low-pressure service network. Because the exhaust is still at 25 to 35 bar at the moment of release, it carries most of its compression energy.
Recovery ratios of 30 to 50 percent are routinely achieved, dropping specific air consumption to 18 to 24 Nm³ per 1,000 bottles. With high-pressure compressor specific power at 0.12 to 0.18 kWh per Nm³ delivered, this translates into a 10 to 18 percent reduction in total line energy. Expressed as a dimensionless index, a line at 1.00 baseline typically lands at 0.82 to 0.90 after a well-executed recovery installation.
| Bottle format | Blow pressure, bar | Air without recovery, Nm³/1,000 | Air with 40% recovery, Nm³/1,000 | Air energy, kWh/1,000 | Total line index |
|---|---|---|---|---|---|
| 330 mL still water | 25–30 | 18–26 | 12–17 | 1.7–2.9 | 0.84 |
| 500 mL still water | 25–32 | 26–38 | 17–24 | 2.4–4.1 | 0.85 |
| 1.5 L still water | 28–34 | 62–88 | 40–56 | 5.6–9.5 | 0.86 |
| 1.5 L carbonated | 32–40 | 72–104 | 47–66 | 6.6–11.2 | 0.87 |
| 2 L carbonated | 34–40 | 92–132 | 60–84 | 8.4–14.3 | 0.88 |
| 500 mL hot-fill | 30–38 | 30–44 | 20–29 | 2.8–4.9 | 0.89 |
| 5 L water jar | 28–34 | 190–270 | 124–172 | 17.4–29.2 | 0.86 |
Air quality and its hidden cost
Blowing air contacts the bottle interior, so its quality is a food safety matter as well as a maintenance one. Oil-free or oil-lubricated compressors with multi-stage filtration must deliver air meeting food-contact requirements, and the pressure dew point should be at least -20 °C on the high-pressure circuit. Wet air causes solenoid pilot valve sticking, producing erratic pre-blow timing faults that are notoriously difficult to diagnose and that show up as intermittent wall distribution defects rather than as obvious machine alarms.
Leakage deserves explicit budgeting. On mature installations, compressed air leaks of 8 to 20 percent of generated volume are common and are usually invisible because they occur during production noise. A quarterly ultrasonic leak survey typically recovers 5 to 12 percent of air demand at negligible effort.
Bucket Four: Chilled Water and Mould Cooling
Chilled water and mould cooling represent 1.5 to 3 percent of total operating cost and 12 to 18 percent of line electrical demand. The bucket is small but strategically important because mould temperature control directly governs cycle time, base clearance, and dimensional stability.
Body moulds for cold-fill formats run at 8 to 15 °C, with 10 to 12 °C the common setpoint for still water. Neck and base moulds usually run on a separate loop at 12 to 18 °C to prevent condensation and thread distortion. The chiller must remove essentially all the heat the oven put into the preform, which creates a direct coupling: every kilowatt-hour saved in the oven reduces chiller duty by roughly 0.25 to 0.35 kWh, so oven optimisation pays twice.
Water consumption is modest when the loop is closed. Make-up water for a closed-loop system with plate heat exchangers stays below 0.8 L per 1,000 bottles in temperate conditions, rising to 1.5 to 3.0 L per 1,000 bottles where evaporative cooling towers operate in hot, dry climates. Open-loop or poorly maintained systems consume several times this.
Water chemistry is the quiet cost driver. Where make-up hardness exceeds roughly 200 ppm, scale deposits in the narrow mould cooling channels raise effective mould surface temperature by 3 to 8 °C. The visible consequences are lengthened cycle time, poor base clearance, rocking bottles, and increased scrap. Softening the make-up water and running a glycol secondary loop prevents this entirely, and quarterly condenser cleaning maintains chiller approach temperature. In hot climates the chiller should be specified for a 45 °C design ambient rather than the catalogue-standard 35 °C, since capacity falls 12 to 20 percent between those conditions.
Bucket Five: Labour and Operator Coverage
Labour accounts for 3 to 8 percent of operating cost on an automatic multi-cavity line, but its influence extends well beyond its share because manual handling caps the sustainable yield and utilisation of the whole line.
Expressed in physical terms, coverage requirements differ sharply by automation depth. A semi-automatic two-cavity line requires 8 to 14 operator-hours per shift once preform loading, bottle collection, bagging, and inline quality checks are counted. A fully automatic six to eight cavity line with automatic preform feeding, air conveying, and automatic bagging requires 3 to 5 operator-hours per shift. A blowing-filling-capping combiblock requires 4 to 7 operator-hours per shift for a substantially larger output because blowing, filling, and capping share a single supervision point.
| Machine class | Operator-hours / shift | Sustainable running time | Handling-related scrap | Labour share of cost |
|---|---|---|---|---|
| Semi-automatic 2 cavity | 8–14 | 65–75% | 0.8–1.8% | 12–20% |
| Full automatic 4 cavity | 4–6 | 78–86% | 0.3–0.8% | 6–10% |
| Full automatic 6–8 cavity | 3–5 | 82–90% | 0.2–0.6% | 4–7% |
| FGX high speed 8–12 cavity | 3–5 | 85–92% | 0.1–0.4% | 3–5% |
| Blow-fill-cap combiblock | 4–7 | 84–91% | 0.1–0.3% | 3–6% |
The secondary effects are what matter. Manual preform loading forces periodic line pauses for hopper replenishment, capping sustainable running time at roughly 65 to 75 percent of scheduled hours. Manual bottle collection introduces handling scuffs and neck contact that raise the reject rate by 0.3 to 1.0 percentage points. Both effects compound with the labour share itself, which is why automation typically reduces the combined labour-plus-scrap-plus-availability burden by far more than the headcount reduction alone suggests.
Skill level also affects the cost structure. A line operated by staff trained only to start, stop, and clear jams will run conservative oven settings with generous safety margins, consuming 5 to 12 percent more oven energy than necessary. Training two operators per shift to full recipe-change and pyrometer-verification competence usually recovers that margin within weeks.
Bucket Six: Wear Parts and Consumables
Wear parts and consumables represent 2 to 4 percent of operating cost, and this bucket is unusual in that neglecting it does not reduce cost but transfers it, at an unfavourable exchange rate, into the maintenance and scrap buckets.
The consumable set on a multi-cavity PET blow machine is well defined and its life expectancy is predictable, which means the annual replacement schedule can be budgeted in physical units rather than estimated.
| Component | Typical life | Replacement basis | Symptom before failure | Consequence if neglected |
|---|---|---|---|---|
| Quartz infrared lamps | 6,000–10,000 h | Running hours | Drifting body temperature | Uneven wall, higher scrap |
| Blow valve seals | 15–25 million cycles | Cycle count | Slow pressure rise, soft base | Air consumption rises 10–20% |
| Stretch rod guide bushings | 8–15 million cycles | Cycle count | Off-centre base, rocking | Scrap rises 1–3 points |
| Stretch rod tips | 10–20 million cycles | Cycle count | Base gate marking | Cosmetic rejects |
| Solenoid pilot valves | 30–50 million cycles | Cycle count | Erratic pre-blow timing | Intermittent wall defects |
| Preform grippers and springs | 12–24 months | Calendar | Dropped preforms at transfer | Frequent short stops |
| Mould vent inserts | 3–8 million shots | Shot count | Trapped air marks | Surface defects |
| HP compressor valve plates | 4,000–8,000 h | Running hours | Falling delivery, hot discharge | Line stop, very high impact |
| HP compressor piston rings | 8,000–12,000 h | Running hours | Oil carryover | Air quality failure |
| Air dryer desiccant | 24–36 months | Calendar | Rising dew point | Valve sticking |
| Filter elements | 4,000–8,000 h | Differential pressure | Rising pressure drop | Compressor works harder |
| Chiller condenser cleaning | Quarterly | Calendar | Rising approach temperature | Mould temperature drift |
The compressor items warrant emphasis. Valve plates and piston rings on the high-pressure machine are simultaneously the most consequential wear parts on the line and the most frequently deferred, because their degradation is gradual and shows up first as slightly reduced output rather than as an alarm. A valve plate inspection every 4,000 hours, quarterly oil analysis, and continuous discharge temperature trending typically extend compressor MTBF by 40 to 80 hours and prevent the single most expensive failure mode in the plant.
Modular machine construction changes the economics of this bucket. YuDa’s modularised design allows worn assemblies to be replaced as units rather than rebuilt in place, which shortens mean time to repair and reduces the skill level required at the customer site. Combined with the remote monitoring system, which allows engineers at the China headquarters to read PLC data and return diagnostic feedback, this materially reduces the downtime penalty associated with wear part failure in regions without a nearby service base.
Bucket Seven: Maintenance, Downtime and Scrap
Maintenance and downtime account for 2 to 5 percent of operating cost directly, but the associated scrap acts as a multiplier on all eight buckets simultaneously, which makes this the most misunderstood part of the cost structure.
Scrap as a multiplier
A bottle rejected after blowing has already consumed its entire share of resin, oven energy, compressed air, chilled water, labour, and wear part life. Rejection does not save any of those inputs; it simply removes the bottle from the denominator. Moving scrap from 3.5 percent to 1.0 percent therefore reduces the total operating cost index by roughly 2.4 to 2.6 percent across every bucket at once. Expressed differently, a 2.5 percentage point scrap reduction is worth about as much as a 20 percent reduction in the entire compressed air bucket.
The dominant scrap modes in multi-cavity PET blowing are wall distribution faults from oven profile drift, base rocking or off-centre bases from stretch rod misalignment, pearling from over-stretching or under-heating, neck deformation from insufficient neck cooling, burst bottles from marginal preform quality, and cosmetic marking from mould vent blockage. Each has a specific and identifiable root cause, which is why structured defect classification pays for itself quickly.
| Defect | Likely root cause | First check | Corrective action | Typical scrap contribution |
|---|---|---|---|---|
| Pearling or stress whitening | Body temperature too low or over-stretch | Pyrometer reading vs recipe | Raise body temperature 2–4 °C | 0.2–0.8% |
| Uneven wall distribution | Oven layer imbalance | Layer-by-layer power trim | Rebalance profile, check lamp age | 0.3–1.0% |
| Rocking or off-centre base | Stretch rod bushing wear or misalignment | Rod centring gauge | Replace bushings, re-centre | 0.2–0.9% |
| Soft or incomplete base detail | Blow pressure loss, valve seal leak | Pressure trace at nozzle | Replace seals, verify 32 bar hold | 0.2–0.6% |
| Neck ovality or thread distortion | Neck temperature above 70 °C | Neck cooling air knife flow | Restore neck cooling, lower layer 1 | 0.1–0.5% |
| Trapped air surface marks | Blocked mould vents | Vent inspection | Clean or replace vent inserts | 0.1–0.4% |
| Burst during blow | Preform defect or moisture | Preform incoming inspection | Tighten supplier specification | 0.1–0.6% |
| Haze at gate | Preform gate crystallinity | Preform visual audit | Reject preform lot | 0.1–0.3% |
Planned versus unplanned maintenance
The economics strongly favour planned intervention. Mean time between failures on a well-maintained multi-cavity line ranges from 250 to 350 hours, while poorly maintained lines fall below 100 hours. Mean time to repair ranges from 25 minutes on a modular machine with local spares to over 8 hours where a part must be shipped internationally. The combination determines availability, and availability determines how the fixed portion of the cost structure is spread.
A practical maintenance cadence for a multi-cavity PET line is: daily visual and pressure checks, weekly review of the top five stop reasons, monthly specific air consumption trending as a leak indicator, quarterly ultrasonic leak survey and chiller condenser cleaning, 4,000-hour compressor valve inspection, and annual full mould refurbishment including vent cleaning and surface polishing.
Bucket Eight: Quality, Compliance and Plant Overhead
Quality, compliance, and overhead account for 3 to 6 percent of operating cost and are the buckets most often omitted from vendor comparisons, yet they are unavoidable for any plant supplying regulated beverage or pharmaceutical markets.
The routine quality workload on a PET bottle line includes first-off inspection at every format change, hourly dimensional checks on neck finish and overall height, periodic top load testing, drop testing at fill temperature, burst pressure testing for carbonated formats, wall thickness mapping by section weight, and leak testing either inline or by sample. Laboratory consumables, gauge calibration, and technician time all sit in this bucket.
Compliance requirements vary by destination market and product. Machine safety conformity under CE marking governs guarding, light curtains, emergency stop architecture, and the technical file. ISO 9001 quality management certification is expected by most multinational fillers and increasingly by regional ones. Food contact compliance for the bottle itself is governed by FDA regulations in the United States, EU 10/2011 in Europe, and the GB 4806 series in China. ISO 14001 environmental management and ISO 22000 food safety management appear increasingly in customer audit requirements. Where the line feeds aseptic or extended-shelf-life filling, microbiological validation adds a further layer with routine environmental monitoring.
Clean-in-place operation belongs here for combiblock installations. A typical CIP cycle uses 2 to 4 percent caustic at 60 to 80 °C followed by a 1 to 2 percent acid rinse, with the full sequence taking 45 to 90 minutes. For aseptic filling, bottle sterilisation with hydrogen peroxide or peracetic acid must achieve at least a six-log reduction, with the filling zone held at positive pressure under sterile filtered air. These operations consume chemicals, water, energy, and production time, and they should be explicitly budgeted rather than absorbed into general overhead. For standard still water and carbonated products, clean filling with correct rinsing is materially lighter than full aseptic and should be preferred where the product allows.
Where the blow line is integrated with filling, water use for rinsing enters this bucket too. A water rinser consumes 1 to 2 L per 1,000 bottles, whereas an ionised air rinser consumes essentially none. Because an integrated blow-fill-cap block never exposes the bottle to operators, floors, or storage dust, the air rinser is usually sufficient, which is one of the quieter cost advantages of integration.
How Cost Shares Shift from 2 to 20 Cavities
Cavity count reshapes the operating cost composition in a predictable way: it dilutes every fixed and semi-fixed bucket while leaving the resin bucket untouched. Understanding this asymmetry is essential to choosing the right machine class.
Resin consumption per bottle is a function of preform weight alone and does not change with cavity count. Energy per bottle falls because the oven, chiller, and compressor all operate closer to their efficient design points and because fixed parasitic loads are spread across more output. Labour per bottle falls sharply because a single operator supervises the same machine regardless of how many cavities it carries. Maintenance and overhead per bottle fall for the same reason.
| Cavities | Typical BPH | Resin share | Energy share | Air share | Labour share | Other share | Total cost index |
|---|---|---|---|---|---|---|---|
| 2 (semi-auto) | 1,000–1,600 | 58% | 15% | 7% | 13% | 7% | 1.00 |
| 4 | 4,000–6,000 | 64% | 12% | 6% | 8% | 10% | 0.91 |
| 6 | 6,000–9,000 | 67% | 11% | 6% | 6% | 10% | 0.86 |
| 8 (FGX) | 16,000–24,000 | 69% | 10% | 5% | 5% | 11% | 0.82 |
| 12 (FGX) | 24,000–34,000 | 71% | 9% | 5% | 4% | 11% | 0.79 |
| 16–20 | 36,000–50,000 | 72% | 9% | 4% | 4% | 11% | 0.78 |
Two conclusions follow. First, the cost index improvement flattens sharply beyond about 12 cavities, moving only from 0.79 to 0.78 as cavity count rises to 20. The marginal benefit of very high cavity counts is therefore small unless the output is genuinely needed. Second, because resin share grows as cavity count rises, lightweighting becomes proportionally more important on large machines, not less.
The table assumes constant utilisation, which is the critical caveat. If a 12-cavity line runs at 50 percent utilisation while a 6-cavity line runs at 85 percent, the cost index advantage reverses entirely, because fixed overhead is then spread across fewer bottles on the larger machine. Cavity count should be selected so that realistic sustained demand corresponds to 70 to 80 percent of achievable output.
Specific Consumption Benchmarks by Bottle Format
Specific consumption benchmarks provide the reference points against which any operating line should be audited. The figures below represent well-configured automatic multi-cavity machines with air recovery active and ovens in good condition, measured at the plant boundary.
| Format | Preform weight, g | Total energy, kWh/1,000 | Air, Nm³/1,000 | Water make-up, L/1,000 | Target scrap | Target OEE |
|---|---|---|---|---|---|---|
| 330 mL still water | 6.5–8.5 | 8–11 | 12–17 | 0.3–0.7 | <1.0% | >80% |
| 500 mL still water | 8.5–12.5 | 10–14 | 17–24 | 0.4–0.8 | <1.0% | >80% |
| 1.5 L still water | 22–30 | 17–24 | 40–56 | 0.6–1.2 | <1.2% | >78% |
| 1.5 L carbonated | 36–44 | 21–29 | 47–66 | 0.7–1.4 | <1.5% | >76% |
| 2 L carbonated | 45–54 | 25–34 | 60–84 | 0.8–1.6 | <1.5% | >76% |
| 500 mL hot-fill | 26–34 | 18–27 | 20–29 | 0.9–1.8 | <2.0% | >74% |
| 1 L edible oil | 24–32 | 15–21 | 32–45 | 0.5–1.0 | <1.3% | >77% |
| 5 L water jar | 95–130 | 52–74 | 124–172 | 1.5–3.0 | <2.0% | >70% |
Auditing against these benchmarks is straightforward. Install separate sub-metering on the oven, the high-pressure compressor, and the chiller. Record cumulative qualifying bottle count from the discharge counter, not the mould cycle counter. Divide, and compare. A line consuming 19 kWh per 1,000 bottles on a 500 mL still water format is carrying roughly 40 percent excess energy burden, and the diagnostic sequence should be oven condition first, then air leakage, then chiller approach temperature.
Trending matters more than absolute figures. Specific air consumption is an especially sensitive early indicator: a rise of 8 to 12 percent over baseline almost always indicates blow valve seal degradation or a developing leak, and it appears in the data weeks before it appears as a soft-base defect at the quality station.
Cost Index Modelling: Baseline Versus Optimised Machine
Cost index modelling compares two machines producing the same bottle at the same rate, expressing the difference as a dimensionless ratio. It is the cleanest way to evaluate competing specifications without reference to currency.
Consider two 8-cavity automatic lines producing 500 mL still water bottles. The baseline machine has a conventional oven with wide heater spacing, no air recovery, an oversized valve block, a chiller rated for 35 °C ambient, and a 12.0 g preform. The optimised machine has a 38.1 mm heater distance oven with ceramic reflectors and layer trim, 40 percent air recovery, a short-coupled valve block, a chiller rated for the actual site ambient, and a 9.5 g preform.
| Bucket | Baseline index | Optimised index | Physical change | Reduction |
|---|---|---|---|---|
| Preform resin | 0.690 | 0.546 | 12.0 g to 9.5 g | -20.8% |
| Electrical energy, oven and drives | 0.108 | 0.072 | Oven electricity down 33% | -33.3% |
| Compressed air | 0.062 | 0.038 | 34 to 21 Nm³/1,000 | -38.7% |
| Chilled water and cooling | 0.024 | 0.019 | Lower oven heat load | -20.8% |
| Labour | 0.048 | 0.045 | Fewer manual interventions | -6.3% |
| Wear parts and consumables | 0.030 | 0.026 | Modular replacement, longer seal life | -13.3% |
| Maintenance and downtime | 0.038 | 0.026 | MTBF 150 h to 280 h | -31.6% |
| Quality, compliance, overhead | 0.042 | 0.038 | Fewer format-change rejects | -9.5% |
| Total | 1.042 | 0.810 | Scrap 3.5% to 1.0% applied | -22.3% |
The result is a 22.3 percent reduction in operating cost index from the same nominal output. Two-thirds of that reduction comes from lightweighting, which underlines the earlier point that resin dominates. The remaining third comes from utility and reliability engineering, which is nevertheless significant because those gains are permanent and require no ongoing effort once designed in.
It is worth noting what does not appear in this comparison. Machine purchase scope is deliberately excluded, because the analysis addresses running burden rather than acquisition. In practice the optimised specification carries a higher acquisition index, typically 1.05 to 1.15 relative to baseline, which is recovered through operating savings in a small fraction of the machine’s service life.
Prioritised Actions to Reduce Operating Cost
The eight-bucket structure produces a natural priority order. Working the buckets in order of share multiplied by controllability yields the fastest reduction with the least disruption.
Priority one: preform weight programme
Because resin is 60 to 75 percent of the total, a structured lightweighting programme delivers more than everything else combined. Reduce in 0.3 to 0.5 g increments. At each step run the full validation panel: top load, drop at fill temperature, burst for carbonated formats, and 24-hour dimensional stability. Consider neck finish conversion to a lighter standard, deeper petaloid base geometry, and preform body redesign to raise natural stretch ratio. Expect 15 to 25 percent resin reduction over a two to three step programme on a legacy format.
Priority two: oven energy
Replace lamps at end of nominal life rather than at failure, since spectral output degrades gradually. Install or restore ceramic back reflectors. Enable individual lamp layer power trim and rebuild the recipe library around measured pyrometer readings rather than inherited settings. Verify neck cooling air knife flow. On new purchases, specify the reduced heater distance architecture from the outset, since it is not economically retrofittable and delivers 25 to 35 percent oven savings.
Priority three: compressed air
Install high-pressure air recovery if not fitted; expect 30 to 50 percent recovery and 10 to 18 percent total line energy reduction. Audit blow pressure against actual requirement, since many lines run 3 to 6 bar above what the format needs. Shorten valve block to nozzle distance where mechanically possible. Run a quarterly ultrasonic leak survey. Verify pressure dew point at -20 °C or better to prevent pilot valve sticking.
Priority four: scrap and yield
Classify every reject by defect mode weekly and attack the top three. Install pyrometer closed-loop control on preform body temperature to eliminate profile drift. Replace stretch rod guide bushings on cycle count rather than on symptom. Inspect and clean mould vents on a shot-count schedule. Target below 1.0 percent scrap on standard water formats.
Priority five: reliability and maintenance
Build the maintenance cadence around the compressor first, since it is both the largest energy consumer after the oven and the highest-consequence failure. Trend discharge temperature continuously, analyse oil quarterly, inspect valve plates every 4,000 hours. Track MTBF and MTTR as reported metrics, and target MTBF above 250 hours. Hold a defined wear part kit on site to keep MTTR under 60 minutes for common failures.
Priority six: labour and changeover
Train two operators per shift to full recipe-change competence. Group SKUs by neck finish so most changes require only body and bottom moulds. Target a full format change under 50 minutes and a within-family change under 30 minutes. Where manual preform loading or bottle collection remains, evaluate automation on the combined labour, availability, and handling-scrap effect rather than on headcount alone.
A Specification Checklist That Locks in Low Running Cost
Many operating cost outcomes are determined at the specification stage and cannot be recovered later. The following checklist captures the items that must be settled before a purchase order, organised by bucket.
Energy and thermal
- Oven with minimised heater distance, ceramic back reflectors, and individual lamp layer power trim.
- Pyrometer closed-loop control on preform body temperature with stored recipes per format.
- Dedicated neck cooling air knife with independent flow adjustment.
- Written guarantee on total line energy, expressed in kWh per 1,000 bottles at a defined format and rate.
- Separate energy sub-metering points for oven, compressor, chiller, and machine.
Compressed air
- High-pressure air recovery specified from the outset with a stated recovery ratio.
- Blow valve block short-coupled to nozzle; state the dead volume figure.
- Written guarantee on specific air consumption in Nm³ per 1,000 bottles with recovery active.
- Compressor rated for site ambient and altitude, with food-grade air treatment and -20 °C or better pressure dew point.
Cooling
- Chiller rated for actual site design ambient, not catalogue standard; oversize condenser in hot climates.
- Closed-loop mould cooling with plate heat exchangers and glycol secondary circuit.
- Separate temperature control for body mould, neck, and base mould circuits.
- Make-up water softening where hardness exceeds roughly 200 ppm.
Mechanical and maintenance
- Modular construction allowing assembly-level replacement rather than in-place rebuild.
- Integrated cam-linked mould movement to reduce actuator count and re-timing after mould change.
- Quick-clamp mould carriers and tool-less rail adjustment for changeover under 50 minutes.
- Defined wear part kit supplied with the machine, plus at least one spare mould cavity set.
- Remote monitoring with PLC data access for supplier-side diagnostics.
Quality and compliance
- CE conformity documentation including guarding, light curtains, and emergency stop architecture.
- ISO 9001 quality system certification from the builder.
- Food contact compliance documentation appropriate to destination markets, covering FDA, EU 10/2011, or GB 4806 as applicable.
- Cavity-level process data logging for traceability.
- A documented 72-hour continuous production test at contract speed before acceptance, recording BPH, scrap rate, specific energy, and specific air.
Frequently Asked Questions
What are the main operating cost components of an automatic PET multi-cavity blowing machine?
Eight buckets cover essentially all of it: preform resin at 60 to 75 percent of total, electrical energy at 8 to 14 percent, compressed air at 4 to 8 percent, chilled water and cooling at 1.5 to 3 percent, labour at 3 to 8 percent, wear parts and consumables at 2 to 4 percent, maintenance and downtime at 2 to 5 percent, and quality, compliance, and overhead at 3 to 6 percent. Scrap rate acts as a multiplier across all eight rather than as a separate bucket.
How much electricity does a PET multi-cavity blowing machine consume per 1,000 bottles?
A modern high-speed multi-cavity line producing 500 mL still water bottles consumes roughly 10 to 14 kWh per 1,000 bottles measured at the plant boundary, including the infrared oven, high-pressure compressor, chiller, and machine drives. Larger formats scale roughly with bottle volume: 17 to 24 kWh per 1,000 for 1.5 L water and 25 to 34 kWh per 1,000 for 2 L carbonated. Older or poorly maintained lines commonly reach 20 to 30 kWh per 1,000 on the 500 mL format.
How much compressed air does PET stretch blow molding require?
For a 500 mL bottle blown at 32 bar, the geometric requirement is about 16 NL per bottle, but valve block and manifold dead volume inflate this by 60 to 130 percent, giving 26 to 38 Nm³ per 1,000 bottles without recovery. With a recovery system reclaiming 30 to 50 percent of the exhaust, consumption falls to 17 to 24 Nm³ per 1,000 bottles. Specific compressor power is 0.12 to 0.18 kWh per Nm³ delivered at 40 bar.
Does adding cavities reduce operating cost per bottle?
Yes, but only in the non-resin buckets and only if utilisation is maintained. Moving from 2 to 12 cavities takes the total cost index from about 1.00 to 0.79, mainly through dilution of energy, labour, and overhead. Resin share is unaffected by cavity count, which is why the improvement flattens beyond 12 cavities. If the larger machine runs at 50 percent utilisation while a smaller one runs at 85 percent, the advantage reverses entirely.
Which cost reduction action gives the fastest result?
Preform lightweighting, because resin dominates the composition. Reducing a 500 mL preform from 12.0 g to 9.5 g cuts the resin bucket by about 21 percent, which alone moves the total index by roughly 14 points. Within the utility buckets, high-pressure air recovery and reduced oven heater distance are next, cutting total line energy by 10 to 18 percent and oven electricity by over 30 percent respectively.
How much does scrap rate affect operating cost?
Scrap is multiplicative rather than additive. A bottle rejected after blowing has already consumed its full resin, energy, air, water, labour, and wear part burden, so rejection removes it from the denominator without recovering any input. Moving scrap from 3.5 percent to 1.0 percent reduces the total operating cost index by roughly 2.4 to 2.6 percent across every bucket simultaneously.
What blow pressure should I use, and does lowering it save money?
Still water formats generally need 25 to 32 bar and carbonated formats 32 to 40 bar, with pre-blow at 6 to 12 bar. Many lines run 3 to 6 bar above what the format actually requires because settings were inherited rather than optimised. Reducing to the true requirement lowers air consumption roughly in proportion to absolute pressure, but must be verified against base detail definition, mould contact quality, and top load, since under-pressure produces soft bases and poor material distribution.
How do I audit my line against these benchmarks?
Install separate sub-metering on the oven, high-pressure compressor, and chiller. Take the qualifying bottle count from the discharge counter rather than the mould cycle counter, so scrap is excluded. Divide consumption by output and compare to the format benchmarks. If specific energy exceeds the benchmark by more than 25 percent, check oven lamp age and reflector condition first, then compressed air leakage, then chiller approach temperature.
Which wear parts most affect running cost if neglected?
Blow valve seals and high-pressure compressor components. Degraded valve seals raise air consumption by 10 to 20 percent and produce soft bases; they should be replaced at 15 to 25 million cycles. Compressor valve plates at 4,000 to 8,000 hours and piston rings at 8,000 to 12,000 hours are the highest-consequence items because their failure stops the line entirely. Stretch rod guide bushings at 8 to 15 million cycles are third, since wear pushes scrap up 1 to 3 percentage points.
How does recycled PET content change operating cost?
Food-grade recycled PET generally arrives with lower and more variable intrinsic viscosity, higher acetaldehyde, and occasional contamination. Processing adjustments include raising oven body temperature by 2 to 5 °C to compensate for altered infrared absorption from residual colour, tightening incoming preform inspection, and widening the pre-blow pressure window. Well-managed lines run 50 percent recycled content with no measurable scrap penalty, while poorly managed ones see scrap rise 1 to 3 percentage points.
Does an integrated blow-fill-cap block have lower operating cost than a standalone blow machine?
For most still water and non-carbonated applications, yes. Integration removes empty-bottle warehousing, eliminates 0.5 to 1.5 percent handling damage, and usually allows an ionised air rinser instead of a water rinser, saving 1 to 2 L per 1,000 bottles. Operator coverage per unit of output also falls because blowing, filling, and capping share one supervision point. The exception is plants supplying bottles to multiple external fillers, where flexibility outweighs integration efficiency.
What should I write into the purchase specification to protect running cost?
Put numbers, not adjectives, in the contract. Specify total line energy at or below 14 kWh per 1,000 bottles and compressed air at or below 24 Nm³ per 1,000 bottles for a 500 mL still water format with recovery active, both verified during a documented 72-hour continuous production test at contract speed. Add scrap rate below 1.0 percent, full format changeover under 50 minutes, and a defined wear part kit plus one spare mould cavity set supplied with the machine.
Conclusion
The operating cost composition of an automatic PET multi-cavity blowing machine follows a consistent pattern across the global installed base: resin dominates at 60 to 75 percent, utilities occupy the next tier at roughly 14 to 25 percent combined, and labour, wear parts, maintenance, and compliance share the remainder. Scrap multiplies all of it. Any credible improvement programme must respect that ordering, because effort spent on a four percent bucket cannot match effort spent on a seventy percent one.
The practical target profile for a competitive multi-cavity line in 2026 running 500 mL still water is clear: preform weight at or below 9.5 g, total line energy at or below 14 kWh per 1,000 bottles, compressed air at or below 24 Nm³ per 1,000 bottles with recovery active, chilled water make-up below 0.8 L per 1,000 bottles, scrap below 1.0 percent, OEE above 80 percent, MTBF above 250 hours, and full format changeover under 50 minutes. A line meeting all eight lands near a 0.80 cost index against a legacy baseline of 1.00, which is a genuine and durable competitive position.
Equally important is what cannot be fixed later. Oven heater distance, valve block dead volume, chiller ambient rating, and modular serviceability are all determined at specification and are either impossible or uneconomic to retrofit. Everything in the specification checklist above should therefore be settled before a purchase order, not discovered during the second year of production.
YuDa, a Wanplas factory with more than 20 years of PET blow molding experience, 20+ patents, and installations in over 60 countries, builds its standard-speed full automatic series from 1,000 to 7,000 BPH and its FGX high-speed series from 8,000 to 15,000 BPH around precisely these cost drivers: a 38.1 mm heater distance oven that saves over 30 percent of conventional oven electricity, a cam-linking system that combines mould opening, locking, and bottom mould elevation in one servo-driven movement, modular construction for fast assembly-level maintenance, and a remote monitoring system that lets engineers at the China headquarters read PLC data and feed diagnostics back to the customer site. Within the wider Wanplas brand, complementary capability is available from sister factories, including Aibim for injection stretch blow applications below 4,000 BPH and Polyretec for recycled PET preparation where recycled content is part of the material strategy. For an operating cost assessment against your own line, the most useful data to prepare is your bottle format and preform weight, measured kWh and Nm³ per 1,000 bottles, current scrap rate, and format changeover time, since those four inputs locate you precisely within the composition described here.