The PET beverage bottle business is one of the most seasonally exposed segments in the entire plastics conversion industry, and the profit swing between peak and off-season is consistently larger than the volume swing that causes it. A bottler or contract blower that ships 170 index points of volume in July and 60 index points in January is not simply running a business that is “less busy” in winter. It is running two structurally different cost regimes: one where fixed overhead is thinly spread and every incremental bottle is highly accretive, and another where the same overhead block sits on top of a shrunken output base and quietly erodes the margin earned six months earlier. Understanding, quantifying and actively managing that asymmetry is what separates PET bottle operations that compound value year after year from those that merely survive on a good summer.
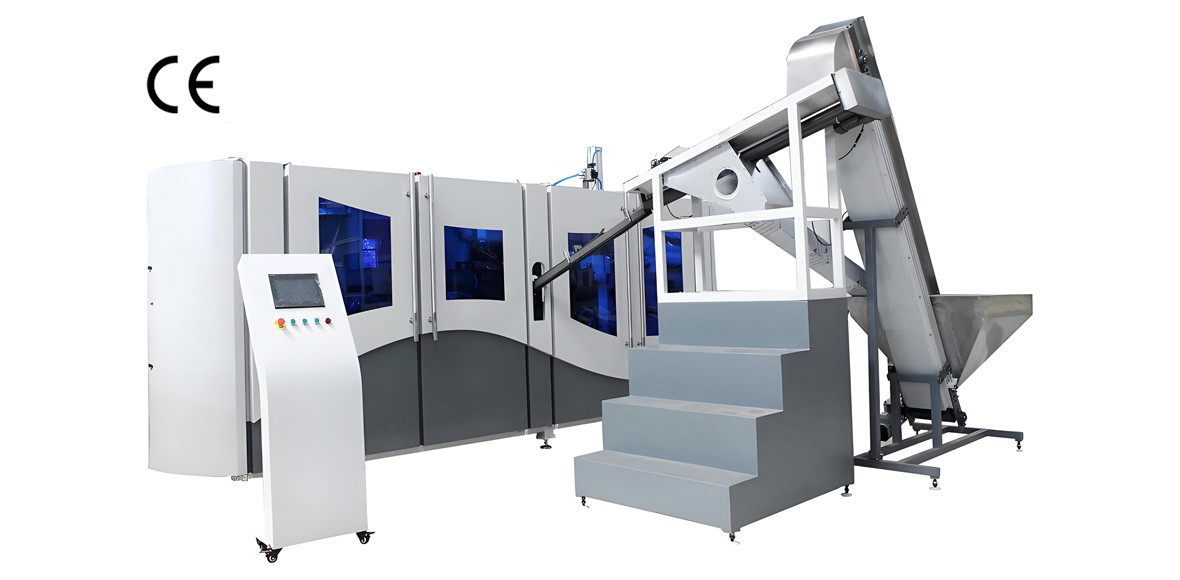
This guide, prepared by the technical team at YuDa Machinery, a Wanplas factory with more than 20 years of experience in PET bottle blow molding machines and installations in over 60 countries, takes a systems view of seasonality. It covers the shape of the demand curve by hemisphere and climate zone, the category-by-category divergence between water, carbonated soft drinks, tea and dairy-type beverages, the mathematical relationship between capacity utilization and unit cost index, the physical bottlenecks that cap output in July, the process and quality risks that shift with ambient temperature and humidity, the inventory logic of preforms versus finished bottles, and the off-season programme that converts idle capacity into next-season capability. All economics in this article are expressed in relative terms — index points, percentages, multiples and qualitative bands — so that the framework transfers cleanly across currencies, regions and plant scales.
Why PET Bottle Profit Swings Harder Than Volume Does
Profit in a PET bottle plant is leveraged against volume because a large share of the cost base does not move with output. When shipment volume falls by 60 percent from summer peak to winter trough, conversion cost per bottle does not fall by anything close to 60 percent — it typically rises by 25 to 40 percent on an indexed basis. That gap is operating leverage working in reverse, and it is the single most important financial characteristic of the PET beverage bottle business.
Three structural features amplify the effect. First, PET stretch blow molding is capital-intensive: rotary and linear blowers, high-pressure compressors, chillers, molds, conveying systems and the building itself carry depreciation regardless of whether the machine runs one shift or three. Second, the process requires a substantial standby utility base — a chiller and dryer package cannot be scaled down proportionally with a half-loaded line, and compressed air systems suffer disproportionate specific energy penalties at part load. Third, skilled operators, mold technicians and quality staff cannot be recruited and released on a monthly cycle without destroying process capability; the core team is effectively fixed.
The counterpart of this leverage is that peak-season incremental bottles are exceptionally valuable. Once the fixed block has been absorbed, additional output carries only variable conversion cost — resin, electricity, air, caps and closures, labour premium — which is why a plant that unlocks a further 8 to 12 percent of peak output through debottlenecking often sees a disproportionate profit response. This asymmetry justifies spending off-season effort and attention specifically on peak-season throughput, rather than distributing improvement work evenly across the year.
A fourth, less-discussed factor is the mix effect. Peak season is dominated by high-volume, low-complexity formats such as 330 millilitre, 500 millilitre and 1.5 litre still water bottles, which run at maximum cavitation and maximum line speed. Off-season demand skews toward smaller, more complex, lower-volume SKUs — specialty teas, functional drinks, seasonal packaging — that carry more changeovers, shorter runs and lower effective output per machine hour. The result is that off-season profit is squeezed from both directions: fewer bottles, and each bottle harder to make.
The defining financial reality of the PET beverage bottle business is that a two-to-three-times volume swing between July and January translates into a far wider profit swing, because 35 to 45 percent of the conversion cost base does not follow demand downward.
Mapping the Seasonal Demand Curve by Region and Climate
Seasonality in PET beverage packaging is fundamentally a function of temperature, daylight and cultural calendar, and it inverts between hemispheres. Any capacity plan built on a single global assumption will be wrong for at least half of the served market. The practical starting point is to build a monthly shipment index for the specific geography served, where 100 equals the trailing twelve-month monthly average.
In temperate northern-hemisphere markets, the curve rises steeply from April, peaks in July or early August, and decays through October into a long winter trough. In temperate southern-hemisphere markets the same shape appears displaced by six months, with the peak falling in December and January. Tropical and equatorial markets show a much flatter profile driven more by rainy-season logistics and festival calendars than by temperature, and this flatness is a genuine structural advantage for plant utilization.
Monthly Shipment Index by Climate Zone
| Month | Temperate North (index) | Temperate South (index) | Tropical / Equatorial (index) | Dominant Driver |
|---|---|---|---|---|
| January | 55 to 70 | 150 to 170 | 95 to 110 | Southern summer, northern deep trough |
| February | 60 to 75 | 140 to 160 | 95 to 115 | Lunar New Year pulse in East Asia |
| March | 80 to 95 | 115 to 130 | 95 to 110 | Northern pre-season build begins |
| April | 100 to 120 | 90 to 105 | 90 to 105 | Channel refill ahead of summer |
| May | 130 to 145 | 70 to 85 | 90 to 105 | Northern peak season opens |
| June | 150 to 165 | 60 to 75 | 85 to 100 | Heat plus school holiday onset |
| July | 160 to 175 | 55 to 70 | 85 to 100 | Annual maximum in most of Asia and Europe |
| August | 155 to 170 | 60 to 75 | 85 to 100 | Sustained heat, tourism flows |
| September | 130 to 145 | 80 to 95 | 90 to 105 | Tapering, channel destocking begins |
| October | 95 to 110 | 100 to 115 | 95 to 110 | Crossover month, both hemispheres near average |
| November | 70 to 85 | 125 to 140 | 95 to 110 | Northern trough entry |
| December | 65 to 85 | 155 to 175 | 100 to 115 | Christmas and year-end festive pulse |
Festival and Event Pulses Layered on the Base Curve
Temperature explains the broad shape, but calendar events create sharp, short-duration spikes that are frequently the true capacity constraint because they compress a month of demand into two or three weeks. These pulses must be modelled separately from the smooth seasonal curve.
| Event Pulse | Typical Window | Production Lead Requirement | Peak Uplift vs Base Month | Format Bias |
|---|---|---|---|---|
| Lunar New Year | Late January to mid February | 6 to 9 weeks ahead | High (plus 30 to 60 percent) | Multipacks, 1.25 to 2 litre CSD, gift-format juice |
| Ramadan and Eid | Moves ~11 days earlier each year | 8 to 10 weeks ahead | Very High (plus 50 to 90 percent) | Water, juice, dairy drinks, date-syrup beverages |
| Summer school holiday | June to August (north) | 4 to 6 weeks ahead | High (plus 25 to 45 percent) | 330 to 600 millilitre single-serve, sports caps |
| Christmas and New Year | Late November to December | 7 to 10 weeks ahead | Medium to High | Large-format CSD, mixers, premium juice |
| Regional sporting events | Variable | 10 to 16 weeks ahead | Medium | Sports drinks, promotional label bottles |
| Heat-wave emergency demand | Unpredictable, 5 to 15 days | Zero to 7 days (buffer-dependent) | Very High, short duration | Plain water, all sizes, minimal decoration |
The heat-wave row deserves particular attention. It is the only pulse that cannot be forecast with useful lead time, and it is the classic scenario where a bottler with preform buffer stock and a spare blowing machine captures a disproportionate share of the market while competitors are sold out. Planning for that scenario is a deliberate choice about how much idle capacity to carry.
Beverage Category Seasonality: Not All Bottles Move Together
Different beverage categories peak at different amplitudes and, critically, at slightly different times, which is the foundation of every effective mix-smoothing strategy. Bottled water and ready-to-drink tea show the sharpest seasonal amplitude, while dairy-based drinks and certain functional beverages are nearly flat. Hot-fill tea typically leads the water curve by about one month because retailers stock the category before the temperature actually rises.
Category Seasonality and Technical Requirement Comparison
| Category | Summer Peak Index | Winter Trough Index | Recommended PET IV (dL/g) | Blowing Complexity | Peak Timing Note |
|---|---|---|---|---|---|
| Still bottled water | 160 to 180 | 50 to 65 | 0.76 to 0.84 | Low | Sharpest amplitude of all categories |
| Carbonated soft drinks (CSD) | 145 to 165 | 65 to 80 | 0.80 to 0.86 | High (petaloid base, pressure retention) | Secondary December pulse from festive demand |
| Ready-to-drink tea (cold fill) | 150 to 170 | 60 to 75 | 0.78 to 0.84 | Medium | Tracks water closely |
| Hot-fill tea and juice | 140 to 165 | 65 to 80 | 0.80 to 0.86 | Very High (heat-set molds, vacuum panels) | Peak arrives about one month earlier |
| Fruit juice (ambient) | 110 to 130 | 80 to 95 | 0.78 to 0.84 | Medium to High | Mild curve, festive uplift in December |
| Sports and isotonic drinks | 155 to 175 | 55 to 70 | 0.78 to 0.84 | Medium (wide-neck, sport cap finish) | Event-driven spikes on top of summer curve |
| Dairy and dairy-type drinks | 95 to 110 | 85 to 100 | 0.76 to 0.82 | Medium (light barrier, aseptic hygiene) | Flattest category, ideal off-season filler |
| Edible oil and condiment PET | 90 to 105 | 100 to 120 | 0.80 to 0.86 | Medium | Counter-seasonal, peaks around winter festivals |
Read this table as a portfolio construction tool rather than a set of facts. The last two rows — dairy-type drinks and edible oil packaging — are the categories that a water-dominant bottler should pursue specifically because their curves are flat or inverted. Adding a counter-seasonal SKU family does not just fill machine hours; it changes the shape of the entire annual cost structure, and does so without any capital outlay beyond molds and possibly a neck-finish changeover kit.
The intrinsic viscosity column matters for seasonal planning in a subtle way. A plant standardized on a single resin IV across all categories simplifies drying and purchasing, but sacrifices bottle performance at the margins. A plant that runs 0.76 to 0.84 dL/g for water and 0.80 to 0.86 dL/g for CSD and hot-fill must manage two resin streams, two drying setpoints and two preform inventories — a manageable complexity in the off-season, a real burden in July. Many operations therefore consolidate to the higher IV grade during peak to eliminate changeover risk, accepting a slightly higher material index in exchange for uninterrupted running.
Capacity Utilization and Unit Cost: The Core Profit Equation
The relationship between capacity utilization and unit conversion cost is the mathematical heart of seasonal profit management, and it is non-linear. Below roughly 60 percent utilization, unit cost climbs steeply because fixed absorption deteriorates faster than variable savings accrue. Above roughly 90 percent, unit cost begins to creep upward again as overtime premiums, expedited logistics, deferred maintenance and rising scrap offset the absorption benefit.
Utilization Versus Indexed Unit Conversion Cost
| Capacity Utilization | Unit Conversion Cost Index | Fixed Cost Absorption | Margin Band | Typical Operating Situation |
|---|---|---|---|---|
| 98 to 100 percent | 102 to 108 | Maximum | High | Overload: overtime, expedites, scrap creep, no maintenance window |
| 95 percent (baseline) | 100 | Excellent | Very High | Optimum: full three-shift running with planned short stops |
| 85 percent | 102 to 105 | Very good | High | Healthy shoulder season, room for changeovers |
| 70 percent | 108 to 115 | Moderate | Medium | Two-shift operation, some lines idle |
| 55 percent | 116 to 126 | Weak | Low | Early off-season, single shift plus maintenance |
| 45 percent | 125 to 140 | Poor | Very Low | Deep trough, most lines stopped, standby utilities running |
| 30 percent | 145 to 175 | Very poor | Negative contribution risk | Extended shutdown territory; consider consolidating onto one line |
Two operational conclusions follow directly. First, the goal is not to maximize utilization but to keep it inside the 80 to 95 percent corridor for as many months as possible; running flat out at 100 percent is measurably worse than running at 95 percent with a controlled maintenance window. Second, when the trough drops below roughly 45 percent, consolidating output onto the smallest number of lines — even if that means running one machine at 90 percent rather than three at 30 percent — reduces the effective cost index materially, because chillers, compressors and utility loops can be isolated line by line.
Fixed Versus Variable Cost Split in a PET Bottle Operation
| Cost Element | Behaviour | Share of Conversion Cost | Off-Season Reduction Potential |
|---|---|---|---|
| Equipment depreciation and amortization | Fully fixed | 12 to 20 percent | None |
| Plant, land and facility charges | Fully fixed | 6 to 10 percent | None (unless space is sublet) |
| Core salaried and technical staff | Fixed | 10 to 15 percent | Low (redeploy to maintenance and training) |
| Standby utilities and building services | Semi-fixed | 4 to 8 percent | Medium (isolate idle loops) |
| Process electricity (oven, compressor, chiller) | Variable with a fixed floor | 18 to 26 percent | High |
| Direct and temporary shop-floor labour | Variable | 12 to 18 percent | High |
| Consumables, spares and mold wear | Variable | 6 to 10 percent | Medium |
| Outbound logistics and handling | Variable | 8 to 14 percent | High |
Summing the fixed and semi-fixed rows gives the characteristic 35 to 45 percent fixed block referenced throughout this article. Note that resin is deliberately excluded from this conversion-cost view; in a tolling or contract-blowing arrangement resin is often customer-supplied, and even where it is not, it behaves as a pure pass-through variable that obscures the operating leverage picture. Analyzing conversion cost separately from material is the discipline that makes seasonal decisions legible.
Peak Season Bottleneck Audit: Where Output Actually Stops
In peak season, profit is capped by the single most constrained resource in the chain, and in PET bottling that constraint is frequently not the blow molding machine itself. Compressed air capacity, chilled water, preform supply and finished-goods warehouse space each cap output in a substantial share of real plants. A disciplined pre-season bottleneck audit, performed in February or March, is the highest-return two days of planning work in the annual cycle.
Peak Season Bottleneck Checklist
| Bottleneck | Diagnostic Signal | Key Parameter to Verify | Lead Time to Fix | Relative Cost to Fix |
|---|---|---|---|---|
| Blowing machine output | Line runs at rated speed with no waiting time upstream or downstream | Bottles per hour per cavity, oven throughput limit | Long (machine procurement and commissioning) | Very High |
| Insufficient mold cavitation | Machine capable of more cavities than currently fitted | Cavity count versus machine maximum, clamp force margin | Medium (mold manufacture) | Medium to High |
| Preform supply | Blower waits on hopper; emergency preform sourcing | Weeks of preform cover at peak run rate | Short to Medium | Low to Medium |
| High-pressure air (up to about 40 bar) | Blow pressure sags at full speed; bottles under-formed at base | 1.8 to 3.0 normal cubic metres per 1000 bottles of 500 millilitre | Medium | High |
| Chilled water capacity | Mold water temperature drifts above setpoint in afternoon heat | Mold circuit held at 8 to 15 degrees Celsius at worst-case ambient | Medium | Medium to High |
| Filler speed mismatch | Air conveyor backs up or starves; accumulation table always full or empty | Blower rated speed versus filler rated speed, target 5 to 10 percent blower surplus | Medium | High |
| Empty bottle buffer and warehouse | Floor space exhausted; bottles stored outdoors or double-stacked | Cubic metres per thousand bottles; pallet load factor | Short (rent) to Long (build) | Medium |
| Outbound transport fleet | Finished goods accumulate despite line availability | Truck turns per day; loading dock cycle time | Short (contract carriers) | Medium |
| Trained shift personnel | Third shift underperforms first shift by more than 10 percent | Skill matrix coverage per shift; overtime hours versus legal ceiling | Medium (training lead time) | Low |
| Cap, label and secondary packaging supply | Line stops for closures or shrink film | Supplier weekly capacity versus peak weekly draw | Short | Low |
The compressed air row is the one most frequently underestimated. High-pressure air for stretch blow molding is the largest single electrical consumer on most PET lines, and the specific consumption figure of roughly 1.8 to 3.0 normal cubic metres per thousand 500 millilitre bottles varies with bottle weight, base design, preform temperature profile and the presence or absence of air recovery. A plant adding a second blower without verifying compressor room capacity will simply move the constraint rather than remove it. Machines in the YuDa FGX high-speed series, rated between 8,000 and 15,000 bottles per hour, are routinely specified together with a compressor and air-recovery audit precisely for this reason.
Warehouse space is the second chronic constraint, and it is a geometry problem rather than a cost problem. Empty PET bottles are overwhelmingly air; a pallet of blown 500 millilitre bottles carries a very small mass and a very poor load factor, so a plant that builds finished-bottle stock ahead of peak consumes floor space at an alarming rate. This is precisely why the preform-versus-bottle inventory question, addressed later in this guide, is the decisive lever for pre-season build strategy.
Before adding a blowing machine for peak season, verify high-pressure air capacity, chilled water duty, preform supply cover and empty-bottle storage volume. In a large share of PET plants, at least one of these four caps output before the blower does.
Seasonal Quality Risk: Summer Humidity Versus Winter Cold
PET stretch blow molding is unusually sensitive to ambient conditions, and the defect spectrum in July is almost the mirror image of the defect spectrum in January. Recognizing this in advance allows the process team to pre-position setpoint changes rather than chase defects reactively during the busiest weeks of the year.
The dominant summer risk is moisture. PET is hygroscopic, with equilibrium moisture uptake typically in the range of 0.2 to 0.6 percent depending on ambient relative humidity and exposure time. Preforms that have been stored in an uncontrolled warehouse through a humid summer absorb surface and bulk moisture. During reheating this moisture can produce haze, white spots and localized wall-thickness irregularity. In addition, cold preforms brought into a hot, humid workshop develop surface condensation, which interferes with infrared absorption in the oven and creates inconsistent heating profiles across the preform body.
The dominant winter risk is thermal. Preforms arriving from an unheated store at low temperature enter the oven well below the assumed starting condition. With a fixed oven residence time, the preform reaches a lower exit temperature than the recipe assumes, and the material is effectively stiffer during stretching. The consequences are poor base clearing, uneven base thickness, thick shoulders, stress whitening at the stretch initiation zone, and elevated burst rates during pressure and drop testing. Preheat times generally need to be extended by 5 to 12 percent relative to summer settings, and preform equalization in a temperature-controlled staging area is strongly preferable to simply raising oven power.
Seasonal Defect Matrix and Countermeasures
| Season | Root Condition | Typical Defect | Process Countermeasure | Risk Level |
|---|---|---|---|---|
| Summer | Preform moisture uptake 0.2 to 0.6 percent | Hazy bottle, white specks, localized thinning | Sealed preform packaging, dehumidified staging area, first-in-first-out discipline | High |
| Summer | Surface condensation on cool preforms | Uneven infrared absorption, wall thickness scatter | Allow 8 to 24 hours equalization at workshop temperature before feeding | Medium to High |
| Summer | Mold water above 15 degrees Celsius | Poor definition, shrinkback, dimensional drift, longer cycle | Verify chiller duty at worst-case ambient; clean condensers before season | High |
| Summer | Elevated workshop temperature and humidity | Operator fatigue, higher inspection miss rate | Spot cooling at inspection stations, rotation schedule, automated vision inspection | Medium |
| Winter | Low preform entry temperature | Uneven base thickness, unclear gate area, thick shoulder | Extend preheat 5 to 12 percent; adjust lamp profile toward body zones | High |
| Winter | Insufficient material orientation | Stress whitening, higher burst and drop-test failure rate | Re-validate stretch rod timing and pre-blow pressure for winter profile | High |
| Winter | Cold compressed air and condensate freezing | Valve sticking, erratic blow pressure, unplanned stops | Verify dryer dew point; insulate and trace outdoor air lines | Medium |
| Shoulder seasons | Large day-to-night ambient swing | Shift-to-shift weight and dimension variation | Closed-loop preform temperature control; log ambient with every SPC sample | Medium |
Across all seasons, the reheat window for standard bottle-grade PET sits broadly in the 95 to 115 degrees Celsius range at the preform surface as it exits the oven, with mold circuits held at 8 to 15 degrees Celsius. What changes seasonally is not the target window but the energy required to reach it and the stability with which it can be held. Documenting a formal summer recipe and a formal winter recipe for every SKU — rather than allowing operators to improvise — is one of the cheapest and most effective quality controls available to a PET bottle plant.
YuDa addresses part of this problem structurally. The heater pitch on YuDa ovens is minimized to 38.1 millimetres, which concentrates infrared energy onto the preform and improves heating uniformity while reducing electricity consumption by more than 30 percent compared with conventional heating ovens. Tighter heating uniformity narrows the process window sensitivity to ambient swings, which is worth as much in January as the energy saving is worth in July.
Energy and Utility Seasonality in PET Blowing
Energy cost per bottle is not constant across the year, even when the process recipe is unchanged. Summer ambient conditions raise chiller and compressor aftercooler load simultaneously, and the combined effect typically lifts the specific electricity index by 8 to 18 percent relative to mild-season operation. This is a real margin effect that occurs precisely during the months of highest volume, and it is frequently invisible because total energy consumption rises with volume anyway.
Seasonal Utility Load Behaviour
| Utility System | Summer Load Change | Winter Load Change | Mitigation Measure | Saving Potential |
|---|---|---|---|---|
| Chilled water plant | Up 15 to 30 percent | Down 20 to 40 percent | Free cooling in winter; condenser cleaning and shading in summer | High |
| High-pressure air compressors | Up 5 to 12 percent (hotter intake, harder aftercooling) | Down 3 to 8 percent | Cool intake ducting, air recovery on blow exhaust, leak survey | Very High |
| Preform reheat oven | Down 3 to 8 percent (warmer preform entry) | Up 5 to 12 percent | Narrow heater pitch, reflective oven surfaces, preform pre-conditioning | High |
| Resin drying and dehumidification | Up 10 to 20 percent (humid intake air) | Down 5 to 15 percent | Closed-loop dryers, dew-point control rather than fixed timer | Medium |
| Workshop HVAC and ventilation | Up 20 to 45 percent | Variable by climate | Zone cooling at critical stations rather than whole-hall conditioning | Medium |
| Compressed air heat recovery | Recovered heat less useful | Recovered heat highly useful for space and water heating | Install recovery heat exchanger during off-season shutdown | Medium to High |
Two structural measures deserve emphasis. Blow-air recovery, which captures a portion of the exhaust from the high-pressure blow circuit and reuses it for low-pressure service air or pre-blow, is one of the highest-return retrofits available on a modern PET line, and it delivers its greatest absolute benefit exactly when the plant is running hardest. Time-of-use load shifting is the second: where tariff structures differentiate between periods, moving preform drying, chiller pull-down and non-critical batch operations away from the highest-demand periods reduces the effective energy index without touching output. Both projects belong on the off-season work list, because both require line downtime to install and commission.
Energy management should be formalized rather than improvised. An ISO 50001 energy management system provides the measurement discipline — baselines, significant energy uses, performance indicators — that makes seasonal energy variance visible instead of buried inside a rising summer utility bill.
Preform Versus Finished Bottle: The Inventory Decision
The single most consequential pre-season decision a PET bottler makes is whether to build inventory as preforms or as blown bottles, and for almost every operation the answer is preforms. A preform occupies roughly one eighth to one twelfth of the volume of the corresponding finished bottle, which transforms the warehouse arithmetic and makes meaningful pre-season stockpiling physically feasible.
Preform Versus Blown Bottle Storage Comparison
| Attribute | Preform Storage | Blown Bottle Storage | Practical Implication |
|---|---|---|---|
| Relative volume per equivalent unit | 1 (reference) | 8 to 12 times greater | Decisive advantage for preforms |
| Warehouse cost index per equivalent unit | 100 (baseline) | 700 to 1100 | Off-season pre-blowing is rarely justified on space grounds |
| Handling damage risk | Low (rigid, compact, bulk-handled) | Medium to High (crush, oval deformation, scuffing) | Bottle stacking height must be limited |
| Deformation over time | Negligible | Real, especially lightweight bottles in warm storage | Blown stock ages poorly in summer heat |
| Recommended maximum storage period | 6 months, dark and dry | 1 to 3 months typical | Preforms allow a genuine pre-season build |
| Acetaldehyde behaviour | Residual AA declines with proper ventilated storage but rises again with heat exposure | Largely fixed at blowing; migration governed by fill and storage | Store preforms cool, ventilated, away from direct sunlight |
| Flexibility of end use | High (one preform can serve several bottle designs sharing a neck finish) | None (committed to one SKU) | Preforms hedge forecast error |
| Inbound transport efficiency | High load factor | Very low load factor; effectively shipping air | Favours blowing on the filling site |
| Typical inventory turn during peak | 10 to 25 days of cover | 1 to 4 days of cover | Bottles are effectively a work-in-process buffer, not a stockpile |
The acetaldehyde point deserves elaboration because it links inventory policy to regulatory compliance. Acetaldehyde is generated by thermal degradation of PET during preform injection and again, to a lesser degree, during reheat. It is volatile and migrates into the packaged liquid, where it imparts a detectable sweet or fruity off-taste in still water at very low concentrations. Water-grade bottles are commonly held to an acetaldehyde migration limit below 1 part per million. Preforms stored in hot conditions, in sealed non-ventilated packaging, or for excessive periods, can present higher residual acetaldehyde at the point of blowing. The practical rules are simple: keep preform storage cool, ventilated, dark and dry; observe strict first-in-first-out rotation; and treat six months as a working maximum rather than a target.
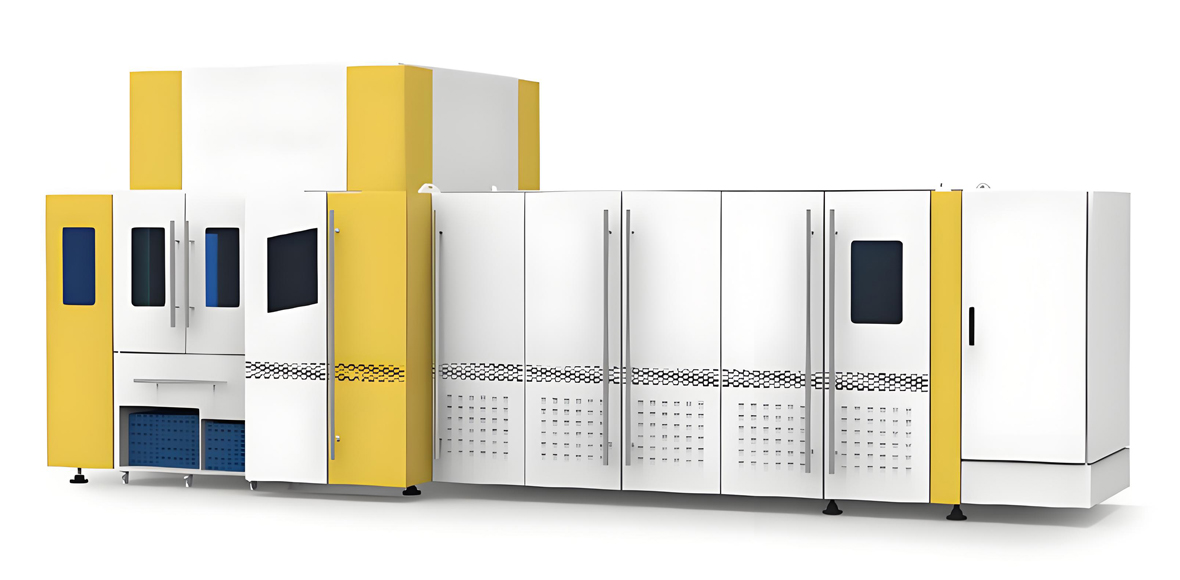
The strategic conclusion is that the correct pre-season build is a preform build, not a bottle build. This in turn shapes the equipment argument: an integrated blow-fill-cap arrangement, such as the linear blowing-filling-capping CombiBlock configurations supplied by YuDa, deliberately eliminates the finished-empty-bottle buffer altogether by blowing bottles directly into the filler. That architecture converts the warehouse problem into a synchronization problem, which is generally the easier of the two to solve.
The Off-Season Playbook: Turning Idle Months Into Margin
Off-season months should be treated as an investment window rather than a loss to be endured. The plants that consistently outperform through the cycle are those that use the trough deliberately: to complete overhauls that are impossible in July, to refurbish molds, to raise workforce capability, to validate new bottle designs and recycled-content formulations, and to take on contract work that partially absorbs fixed cost.
Structured Off-Season Work Programme
| Activity | Best Timing | Objective | Effect on Next Peak | Relative Investment |
|---|---|---|---|---|
| Annual major overhaul of blowers and clamps | Deep trough, first 4 to 6 weeks | Restore mechanical accuracy, replace wear parts | Fewer unplanned stops; higher peak OEE | Medium |
| Mold refurbishment, polishing and vent cleaning | Trough, rolling by mold set | Restore surface finish and venting | Lower scrap; better base clearing | Low to Medium |
| Compressor and chiller service, leak survey | Late trough, before pre-season build | Recover lost utility capacity | Removes a common hidden bottleneck | Low |
| Operator skill matrix and cross-training | Throughout trough | Raise third-shift capability to first-shift level | Closes the night-shift output gap | Low |
| New bottle design trials and lightweighting validation | Mid trough | Reduce gram weight while holding top load and drop performance | Direct material index reduction at peak volume | Medium |
| Recycled PET blend process development | Mid to late trough | Qualify rPET inclusion levels and adjusted process window | Meets brand-owner recycled-content commitments | Medium |
| Preform pre-season build | Last 8 to 10 weeks of trough | Create 10 to 25 days of peak cover in compact form | Buffers heat-wave spikes and preform supply disruption | Low to Medium |
| Contract and toll blowing for third parties | Whole trough | Absorb fixed cost with counter-seasonal customers | Lifts annual utilization band | Low |
| Energy contract and tariff structure review | Early trough | Align contracted demand with actual seasonal profile | Avoids penalty exposure at peak demand | Low |
| Line layout and buffer capacity improvement | Deep trough | Increase accumulation between blower and filler | Decouples short stops; raises line efficiency | Medium |
Lightweighting deserves special mention as an off-season project with peak-season payoff. Reducing bottle gram weight lowers material consumption proportionally at exactly the volume where it matters most, but it narrows the process window and increases sensitivity to preform temperature uniformity and stretch ratio control. Attempting a lightweighting programme in July is an invitation to scrap; validating it in January, with full drop-test, top-load and pressure-cycle verification, converts it into a reliable gain.
Recycled PET development follows the same logic. Blending rPET into bottle-grade preforms shifts the intrinsic viscosity distribution, changes reheat absorption because of colour and residual contamination differences, and generally requires a re-optimized lamp profile. Brand owners increasingly specify recycled content, so the capability is becoming a market-access requirement rather than a differentiator. Within the Wanplas group, the Polyretec factory supplies food-grade PET bottle washing lines from 500 kilograms per hour to 6,000 kilograms per hour, which is the upstream half of that same capability for operations that intend to close the loop internally.
Capacity Planning Models and Peak-to-Trough Ratio
Capacity planning for a seasonal PET business reduces to one question: do you build for the peak, build for the average, or build for something in between and outsource the difference? The answer depends on the peak-to-trough ratio, the reliability of the seasonal forecast, and the availability of counter-seasonal work.
The peak-to-trough ratio is calculated as the highest monthly shipment index divided by the lowest. A temperate northern water bottler with a July index of 170 and a January index of 60 has a ratio of approximately 2.8. A tropical multi-category operation with a December index of 115 and a July index of 88 has a ratio of about 1.3. These two businesses require fundamentally different capacity philosophies, even if they ship identical annual volumes.
Capacity Strategy Comparison
| Strategy | Sizing Basis | Annual Utilization | Peak Service Level | Capital Intensity | Best Fit |
|---|---|---|---|---|---|
| Peak-sized (P90 demand) | Ninetieth-percentile peak week | 50 to 62 percent | Very High | Very High | Brand-owned plants with severe stockout penalties |
| Mean-sized plus outsourcing | Annual average demand | 78 to 88 percent | Medium (depends on partner reliability) | Medium | Regions with a dense contract-blowing network |
| Mean-sized plus preform buffer | Annual average plus 10 to 25 days preform cover | 75 to 85 percent | High | Medium | Most independent bottlers; strong general-purpose choice |
| Large machine plus small machine mix | One high-speed line plus one flexible standard line | 72 to 84 percent | High | Medium to High | Multi-SKU operations with long tail of small runs |
| Multi-category mix smoothing | Portfolio with staggered category peaks | 75 to 85 percent | High | Low incremental (molds and changeover tooling) | Highest return per unit of investment |
| Trough-sized with peak outsourcing | Winter demand level | 90 to 98 percent | Low; high dependency risk | Low | Rarely advisable; peak partners are also busy in peak |
The last row contains the most common strategic error in the sector. Outsourcing peak volume assumes that a contract blower has spare capacity in July, but seasonality is correlated across the entire regional market — every blower in a temperate market is busy in the same eight weeks. Outsourcing works reliably only where the partner serves a counter-seasonal geography or a counter-seasonal category. Otherwise the capacity that appears available in March evaporates precisely when it is needed.
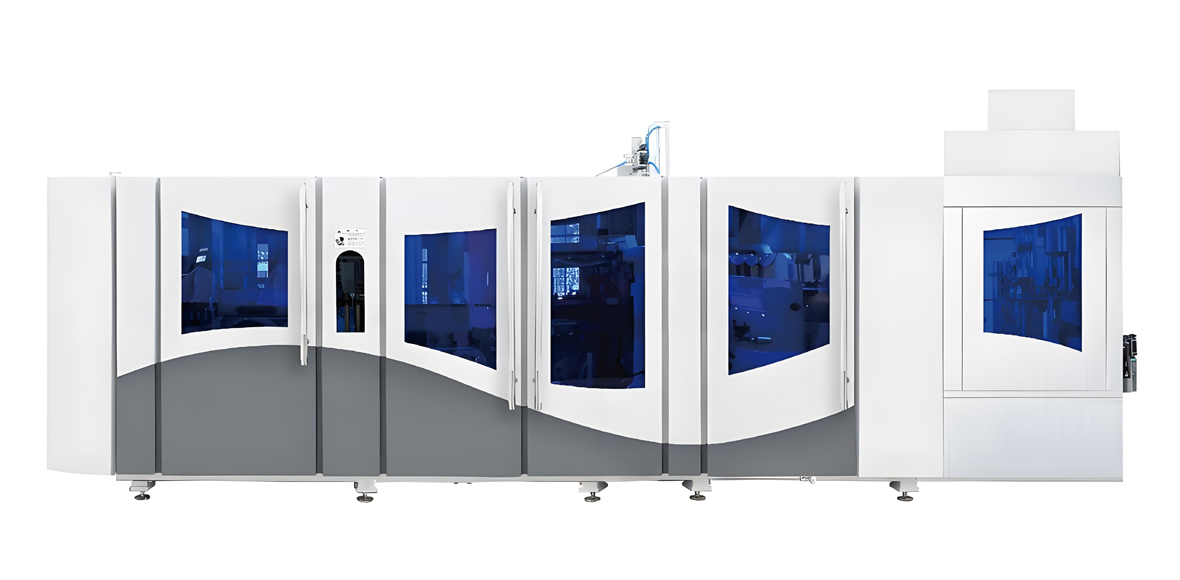
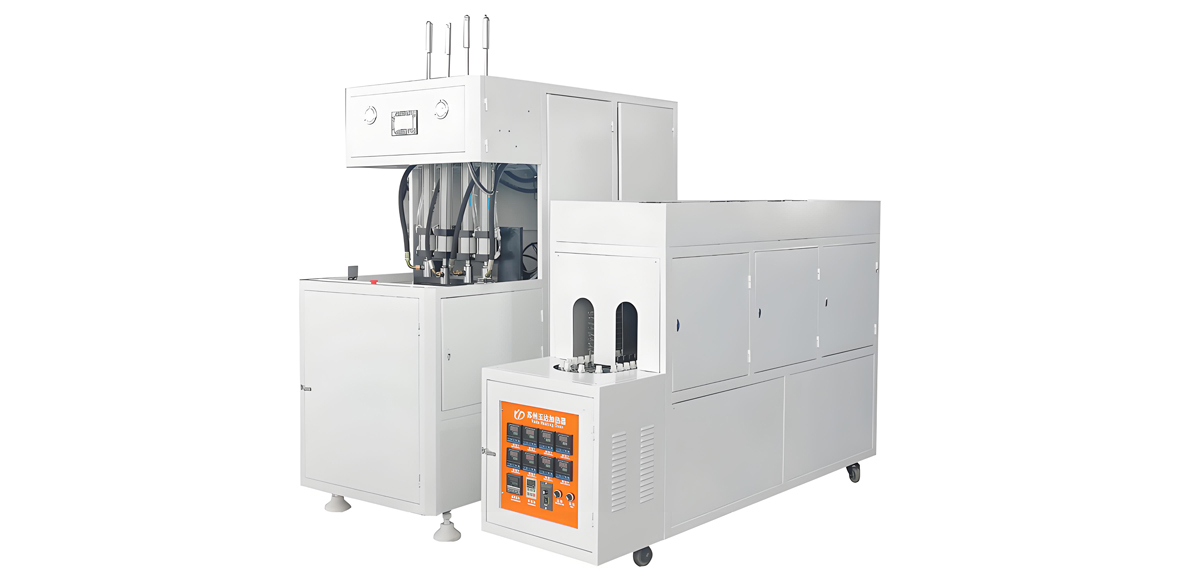
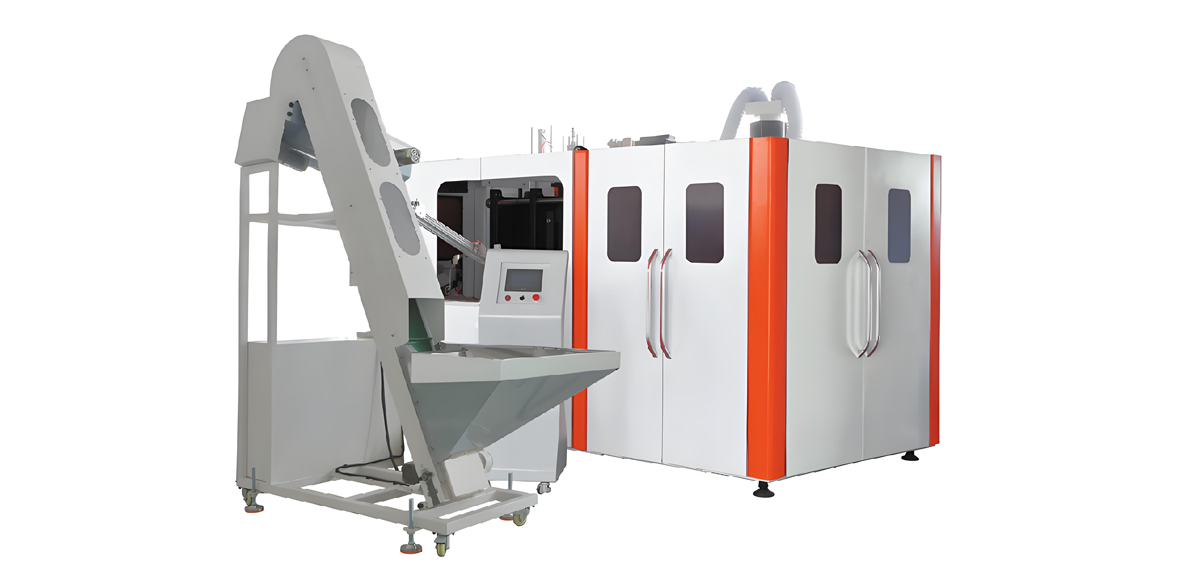
The machine-mix strategy merits practical comment. Pairing one high-speed line with one smaller, more flexible line usually outperforms two identical medium machines. During peak the high-speed line runs the volume SKUs continuously with no changeovers, while the flexible line absorbs the small runs, trials and promotional formats. During the trough the high-speed line is shut down entirely — isolating its chiller and air demand — while the flexible line covers baseline demand at high individual utilization. This is a materially better cost profile than running two half-loaded identical machines. YuDa’s product structure supports exactly this pattern, with FGX high-speed models covering the 8,000 to 15,000 bottles-per-hour band and standard full-automatic models covering 1,000 to 7,000 bottles per hour, alongside semi-automatic units for very small or seasonal-supplementary duty.
Worked Example of Mix Smoothing
Consider a temperate plant with two blowing lines running only still water. Its monthly utilization tracks the water index directly: roughly 95 percent in July, roughly 33 percent in January, and an annual average around 58 percent. Now add a ready-to-drink tea SKU whose peak arrives one month earlier, an ambient juice family with a mild curve and a December festive uplift, and an edible-oil packaging contract that peaks in the northern winter. The composite monthly load flattens substantially: peak months remain near 95 percent, but trough months rise into the 60 to 70 percent range, and annual utilization moves into the 75 to 85 percent band. Referring back to the utilization-versus-cost table, that shift moves the average annual unit cost index down by roughly 8 to 14 points without a single additional machine.
Working Capital Rhythm and Workforce Elasticity
Seasonality reshapes working capital as forcefully as it reshapes production, and the two peaks do not coincide. Cash outflow for resin, preforms, closures and temporary labour front-runs the revenue peak by roughly one to two months, while cash inflow lags shipment by whatever credit terms the channel enforces. The result is that the moment of greatest financial strain typically occurs just before or during the busiest production weeks.
Seasonal Operating Rhythm by Quarter
| Phase | Production Focus | Material Procurement Posture | Workforce Configuration | Receivables Risk |
|---|---|---|---|---|
| Deep trough | Overhaul, mold work, trials, training | Minimum stock; contract negotiation window | Core team only; zero to 5 percent temporary | Low |
| Pre-season build | Preform stock build, line validation runs | Progressive build; lock supply commitments | Core plus 10 to 15 percent temporary, training in progress | Low to Medium |
| Peak ramp | Shift to three-shift running; freeze changeovers | Maximum inbound flow; expedite readiness | Core plus 20 to 30 percent temporary | Medium |
| Peak plateau | Maximum output, minimum SKU complexity | Just-in-time replenishment; buffer drawdown | Full complement; monitor overtime ceilings | High (terms stretch as channel volume peaks) |
| Post-peak taper | Run down buffers; resume changeover flexibility | Reduce ordering ahead of curve | Release temporary staff progressively | Very High (collection concentration risk) |
| Shoulder | Counter-seasonal SKUs, contract work | Normalized | Core plus minimal temporary | Medium |
Two disciplines protect margin through this rhythm. The first is credit discipline during the peak: the temptation to accept extended terms in exchange for peak volume is strongest exactly when working capital is most stretched, and the post-peak taper is when collection failures surface. The second is overtime governance. Temporary labour typically ranges from 15 to 30 percent of the shop-floor headcount at peak, and overtime hours must be managed against statutory ceilings and fatigue limits. Fatigue-driven quality escapes and safety incidents are a recognized peak-season pattern; a plant that plans a fourth relief crew rather than extending three crews indefinitely usually finishes the season with better OEE and a cleaner safety record.
Resin and preform procurement rhythm follows the same logic. Feedstock markets for PET have their own supply and demand cycles driven by upstream aromatics availability, plant turnaround schedules and regional trade flows, and these cycles do not align neatly with beverage seasonality. The operational principle is to secure volume commitment and delivery slots ahead of the season rather than attempting to time procurement, because supply availability rather than any single commercial variable is what stops a line in July.
Compliance and Market Access Across the Seasonal Cycle
Regulatory compliance in PET beverage packaging is not seasonal, but the risk of compliance failure is: peak-season pressure to keep lines running is precisely when documentation discipline, cleaning validation and material traceability are most likely to slip. Treating the compliance framework as a fixed constraint rather than a flexible one is essential.
Applicable Standards and Seasonal Watch Points
| Standard or Regulation | Scope | Seasonal Watch Point |
|---|---|---|
| FDA 21 CFR 177.1630 | PET resin for food contact in the United States market | Verify compliance status of any substitute resin sourced under peak supply pressure |
| EU Regulation 10/2011 | Plastic materials and articles intended to contact food in the European Union | Declaration of compliance must cover every resin and masterbatch lot, including peak substitutes |
| GB 4806.6 | Food contact plastic resins, China national standard | Maintain resin lot traceability through high-throughput months |
| GB 4806.7 | Food contact plastic materials and articles, China national standard | Migration testing schedule must not lapse during peak |
| Acetaldehyde migration limit for water bottles | Commonly specified below 1 part per million | Highest risk with aged or heat-exposed preforms drawn from pre-season buffer |
| ISO 22000 and FSSC 22000 | Food safety management systems | Temporary staff must complete hygiene induction before entering production areas |
| ISO 50001 | Energy management systems | Seasonal baselines needed so summer energy variance is measured, not absorbed |
| CE marking and EN 415-3 | Safety of packaging machines, including forming, filling and sealing machines | Guarding and interlocks must never be bypassed to shorten peak changeovers |
| ISO 9001 | Quality management systems | Change control on process recipes when switching between summer and winter settings |
The safety row is not a formality. EN 415-3 and the associated machinery safety requirements behind CE marking exist because the packaging line is a high-energy environment, and the pressure to shave minutes from a changeover in the middle of a heat wave is exactly the condition under which guards get defeated. Any plant operating at 98 to 100 percent utilization should assume elevated safety risk and respond with additional supervision rather than reduced procedure.
KPI Dashboard and the Seasonal Decision Framework
Managing seasonal profit requires a small set of indicators reviewed on a fixed monthly cadence, with different targets for peak and off-season phases. Applying a single annual target to a business whose utilization moves between 45 and 95 percent produces meaningless variance reports and unhelpful management conversations.
Seasonal KPI Targets
| Indicator | Peak Season Target | Off-Season Target | Why It Matters Seasonally |
|---|---|---|---|
| Overall equipment effectiveness (OEE) | 85 percent or above | 70 percent or above on running lines | Peak OEE converts directly into capturable volume |
| Scrap and reject rate | Below 1 percent | Below 1.5 percent (trial allowance) | Scrap at peak destroys the most valuable machine hours |
| Bottle weight coefficient of variation | 1.5 percent or below | 1.5 percent or below | Tight weight control enables lightweighting to stick year round |
| Specific electricity per 1000 bottles | Within 118 index points of best month | Within 110 index points on running lines | Captures the summer chiller and compressor penalty explicitly |
| Specific high-pressure air per 1000 bottles | 1.8 to 3.0 normal cubic metres for 500 millilitre | Same, plus leak survey verification | Leaks are masked by high demand in peak |
| Capacity utilization | 88 to 95 percent (not 100) | Consolidate to keep running lines above 70 percent | Directly drives the unit cost index |
| On-time delivery (OTD) | 98 percent or above | 99 percent or above | Peak stockouts permanently transfer shelf space to competitors |
| Preform inventory days of cover | 10 to 25 days | Building toward peak target | The primary buffer against heat-wave spikes |
| Finished goods days of cover | 1 to 4 days | 3 to 7 days | Constrained by bottle volume, not by policy preference |
| Unplanned downtime hours per line week | Below 4 | Below 8 | Proves whether the off-season overhaul actually worked |
| Changeover time per mold set | Minimize; freeze non-essential changeovers | Use as improvement target | Changeover capability determines mix-smoothing feasibility |
A Practical Twelve-Month Decision Sequence
Reduced to its essentials, seasonal profit management in the PET beverage bottle business follows a repeatable annual sequence. Immediately after the peak ends, capture the data: actual monthly indices by SKU, actual utilization, actual OEE, and a written record of every constraint that bound output. Early in the trough, perform the bottleneck audit against that record and commission the overhaul and refurbishment programme. Mid-trough, run the improvement projects that require downtime — air recovery, buffer capacity, layout changes, lightweighting validation, recycled-content qualification. Late trough, build preform cover and finalize supply commitments for closures, labels and resin. Pre-season, complete validation runs on every SKU with the summer recipe, verify chiller and compressor capacity at design ambient, and complete temporary-staff training and hygiene induction. Through the peak, freeze changes, protect the maintenance window, monitor the KPI dashboard weekly, and resist commercial terms that will damage post-peak collection. Then repeat.
Equipment selection sits inside this cycle rather than above it. Machine capability, line speed and energy characteristics set the boundaries of what the seasonal plan can achieve, but within any given asset base the levers described here — mix smoothing, preform buffering, bottleneck removal, seasonal recipes, off-season overhaul discipline — typically deliver more profit improvement per unit of effort than adding capacity does.
Frequently Asked Questions
How large is the seasonal swing in PET beverage bottle demand?
In temperate northern-hemisphere markets, monthly shipment volume for bottled water and carbonated soft drinks typically runs at an index of 130 to 175 during May to September against an annual average of 100, and falls to 55 to 75 during November to February. Southern-hemisphere markets show the same shape displaced by six months. Tropical and equatorial markets are far flatter, usually staying inside an 85 to 115 band, which is why tropical operations generally achieve higher annual capacity utilization for the same annual volume.
Why does unit cost rise so sharply when capacity utilization falls?
Fixed and semi-fixed costs — depreciation, plant and facility charges, core salaried staff and standby utilities — normally represent 35 to 45 percent of total conversion cost in a PET bottle plant. When utilization drops from 95 percent to 45 percent, that same block is spread over roughly half the output, pushing the unit conversion cost index from a baseline of 100 up to about 125 to 140. Below 30 percent utilization the index can reach 145 to 175, at which point consolidating output onto fewer lines becomes the correct response.
Is it better to store preforms or finished bottles ahead of peak season?
Preforms are almost always the better format. A preform occupies only about one eighth to one twelfth of the volume of the finished bottle, so the warehouse cost index per equivalent unit is roughly 700 to 1100 for bottles against a baseline of 100 for preforms. Preforms are also far less prone to deformation and remain flexible across bottle designs sharing the same neck finish. Store them dark, dry, cool and ventilated, observe strict first-in-first-out rotation, and treat six months as a working maximum.
What compressed air volume does PET bottle blowing consume?
A typical 500 millilitre still-water bottle consumes roughly 1.8 to 3.0 normal cubic metres of high-pressure air per thousand bottles, delivered at up to about 40 bar. Carbonated soft drink bottles with heavier walls and petaloid bases sit at the upper end of that range. Compressed air is usually the largest single electrical load on a PET line, so peak-season capacity planning must size the high-pressure compressor room on this figure plus margin for leakage, recovery time and simultaneous line starts.
How much does summer heat increase utility load on a PET blowing line?
Mold cooling water must be held at roughly 8 to 15 degrees Celsius all year. As ambient workshop temperature climbs, chiller duty typically rises by 15 to 30 percent versus mild-season conditions, compressor intake and aftercooler load rise by a further 5 to 12 percent, and resin dehumidification load rises by 10 to 20 percent because intake air carries more moisture. The combined effect commonly lifts the specific electricity index by 8 to 18 percent during peak months. Refrigeration capacity should be verified against worst-case summer ambient, not the annual average.
What quality defects are most common in winter production?
Cold preforms entering the oven cause most winter defects. Insufficient preheat produces poor base clearing, uneven base thickness, thick shoulders, stress whitening at the stretch initiation zone and a higher burst rate in pressure testing. Preform equalization in a temperature-controlled staging area is preferable to simply increasing oven power, and preheat times generally need extending by 5 to 12 percent relative to summer settings. Maintaining a documented winter recipe for every SKU prevents operators from improvising.
What quality defects are most common in summer production?
Moisture dominates the summer defect spectrum. PET absorbs 0.2 to 0.6 percent equilibrium moisture depending on humidity and exposure, and preforms that have absorbed moisture produce hazy bottles, white specks and localized wall thinning. Surface condensation on cool preforms brought into a warm humid workshop disrupts infrared absorption and creates thickness scatter. Sealed preform packaging, a dehumidified staging area with 8 to 24 hours of equalization time, and verified chiller capacity together address most summer issues.
Can product mix reduce the seasonality of a PET bottle plant?
Yes, and it is usually the highest-return lever available. A single-category water bottler often runs at only 55 to 65 percent annual utilization. Blending still water with ready-to-drink tea, hot-fill tea and juice, dairy-type beverages and counter-seasonal formats such as edible oil packaging — categories whose peaks are staggered by one to two months or inverted entirely — can lift annual utilization into the 75 to 85 percent band. Because the incremental investment is largely molds and changeover tooling rather than machines, the return per unit of capital committed is very high.
Should peak capacity be sized for average demand or peak demand?
For most independent bottlers, the best answer is to size close to average demand and cover the peak with 10 to 25 days of preform buffer plus a flexible secondary line. Sizing to a P90 peak drives annual utilization down to 50 to 62 percent and carries a Very High capital burden. Sizing to the winter trough and outsourcing the peak is generally unworkable, because regional seasonality is correlated and contract blowers are busy in exactly the same weeks.
What should a PET bottle plant actually do during the off-season?
Run the annual overhaul in the first four to six weeks of the trough, then refurbish and polish molds, service compressors and chillers with a full leak survey, complete operator cross-training against a skill matrix, validate lightweighting and new bottle designs with full drop and top-load testing, qualify recycled PET blend levels, build preform cover in the last eight to ten weeks, and take on counter-seasonal contract work to absorb fixed cost. Energy contract review and layout or buffer improvements also belong in this window because they require downtime.
How does an integrated blow-fill-cap line change the seasonal equation?
An integrated blow-fill-cap arrangement eliminates the empty-bottle warehouse entirely by blowing directly into the filler, which removes one of the most common peak-season physical bottlenecks and reduces handling damage. The trade-off is that blower and filler availability become fully coupled, so a stop anywhere stops everything. This architecture suits operations with a stable SKU set and reliable utilities; operations with a long tail of small runs generally retain a buffered layout on at least one line.
How should peak-season overtime and temporary labour be managed?
Temporary staff typically represent 15 to 30 percent of shop-floor headcount at peak. They must complete hygiene induction and safety training before entering production areas, which means recruiting and training during the pre-season build rather than at the ramp. Overtime should be governed against statutory ceilings and fatigue limits; adding a fourth relief crew usually produces better OEE and fewer quality escapes than extending three crews indefinitely, because peak-season defects and safety incidents cluster around fatigue.
Conclusion
The profit gap between peak and off-season in the PET beverage bottle business is not primarily a demand problem — it is a cost-structure problem that demand merely reveals. A conversion cost base that is 35 to 45 percent fixed will always punish a plant whose utilization swings between 45 and 95 percent, and no amount of peak-season effort fully compensates for months spent at a unit cost index of 125 to 140. The operations that manage this well do three things consistently: they flatten the demand curve they serve through deliberate multi-category mix construction, they buffer the peak with preforms rather than bottles, and they use the trough as a structured investment window rather than a period of reduced activity.
The technical detail matters because it determines whether those strategies are executable. Verified chiller duty at worst-case summer ambient, high-pressure air capacity checked against the 1.8 to 3.0 normal cubic metres per thousand bottles benchmark, documented summer and winter oven recipes, preform storage discipline that respects the six-month working limit and the sub-1 part per million acetaldehyde expectation for water, and a KPI dashboard with separate peak and off-season targets are what turn a seasonal plan into seasonal performance. Compliance frameworks including FDA 21 CFR 177.1630, EU 10/2011, GB 4806.6, GB 4806.7, ISO 22000, FSSC 22000, ISO 50001 and the machinery safety requirements behind CE marking and EN 415-3 form the fixed boundary within which all of it operates.
YuDa Machinery, a Wanplas factory, has spent more than 20 years building PET bottle blow molding machines for customers in over 60 countries, holds more than 20 patents, and supports its installed base with remote monitoring that lets engineers in China review machine data and respond to abnormalities on customer sites. Its range spans semi-automatic units, full-automatic standard machines from 1,000 to 7,000 bottles per hour, FGX high-speed machines from 8,000 to 15,000 bottles per hour, and linear blowing-filling-capping CombiBlock configurations for compact integrated lines — a portfolio deliberately structured to let bottlers combine a high-speed workhorse with a flexible secondary line, which is precisely the machine mix that seasonal operations need. Within the wider Wanplas brand, complementary capability spans recycling, extrusion and other blow molding technologies, reflecting the group’s stated mission to warm global customers with China plastic machinery. For operators planning the 2026 season, the most valuable conversation to have is not about machine speed in isolation, but about how the whole line — blower, air system, chiller, buffer and filler — behaves across the full twelve-month cycle.