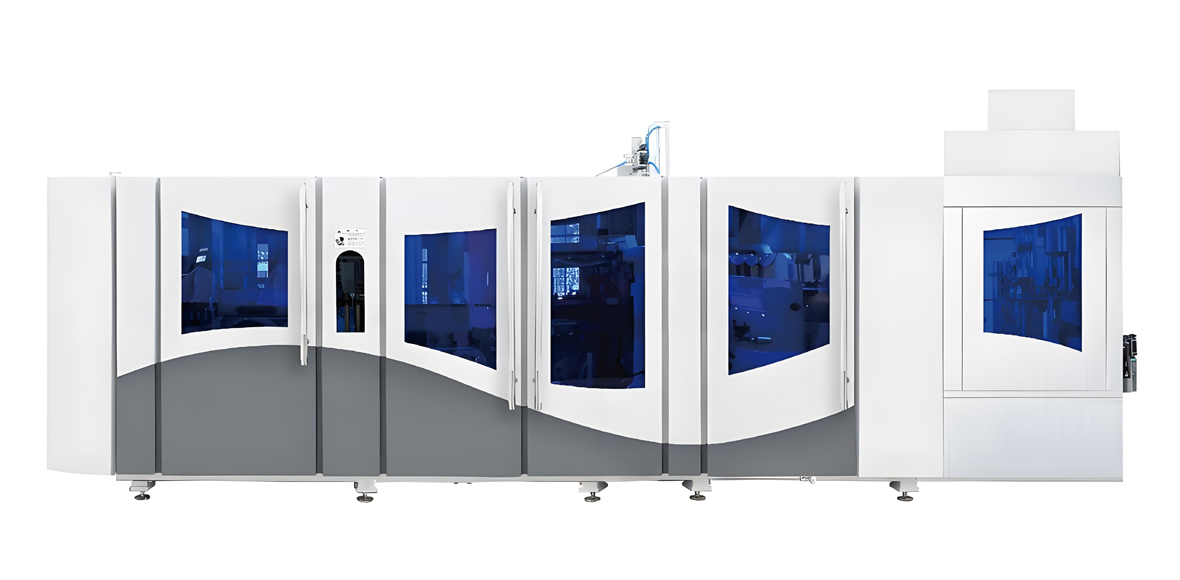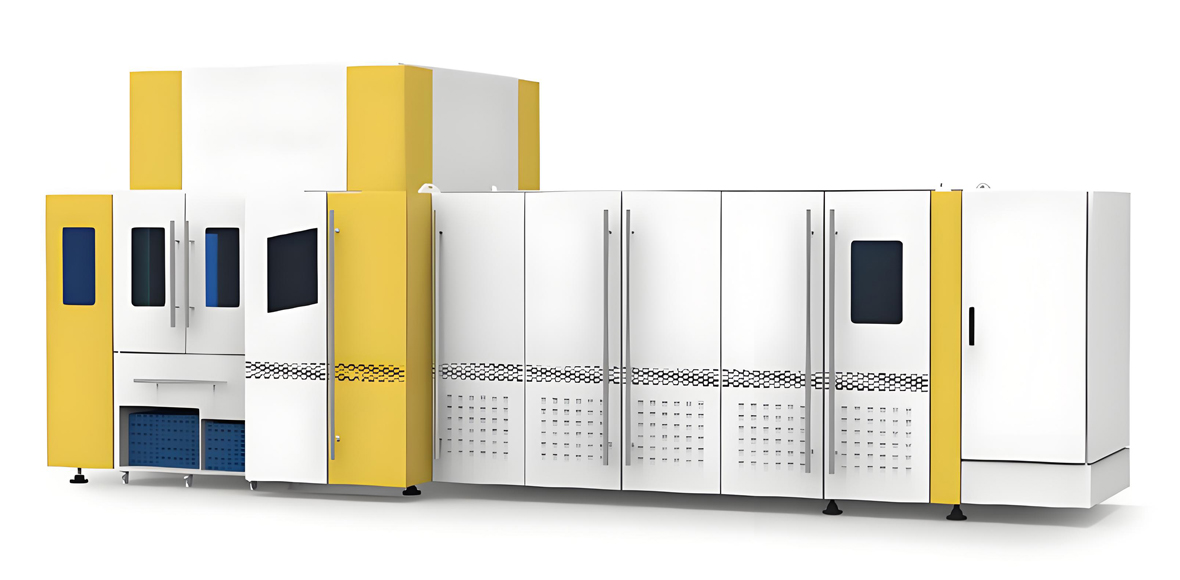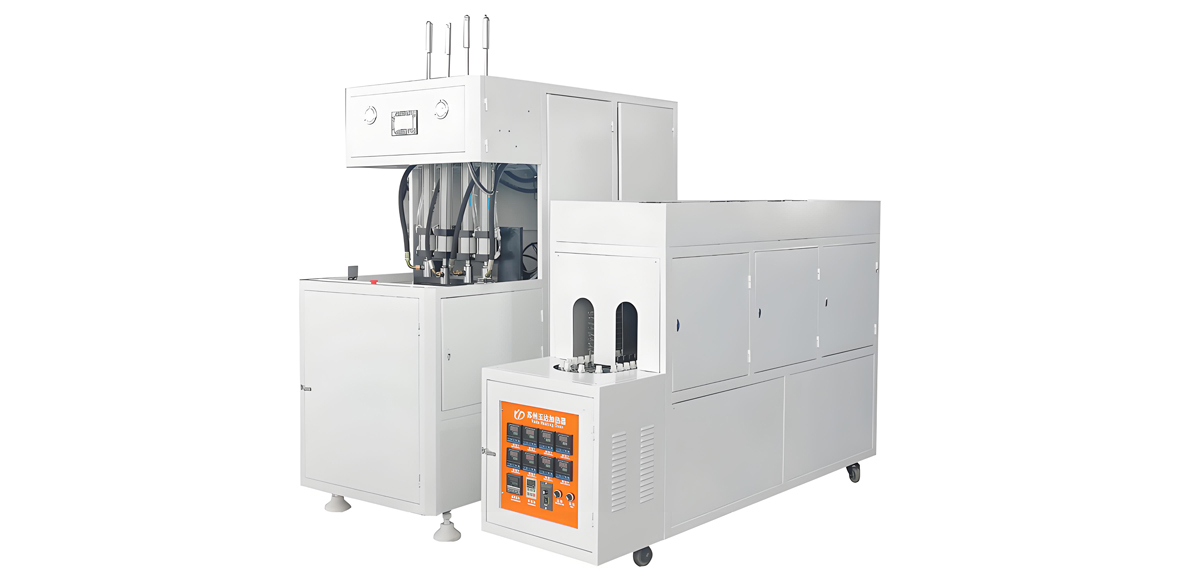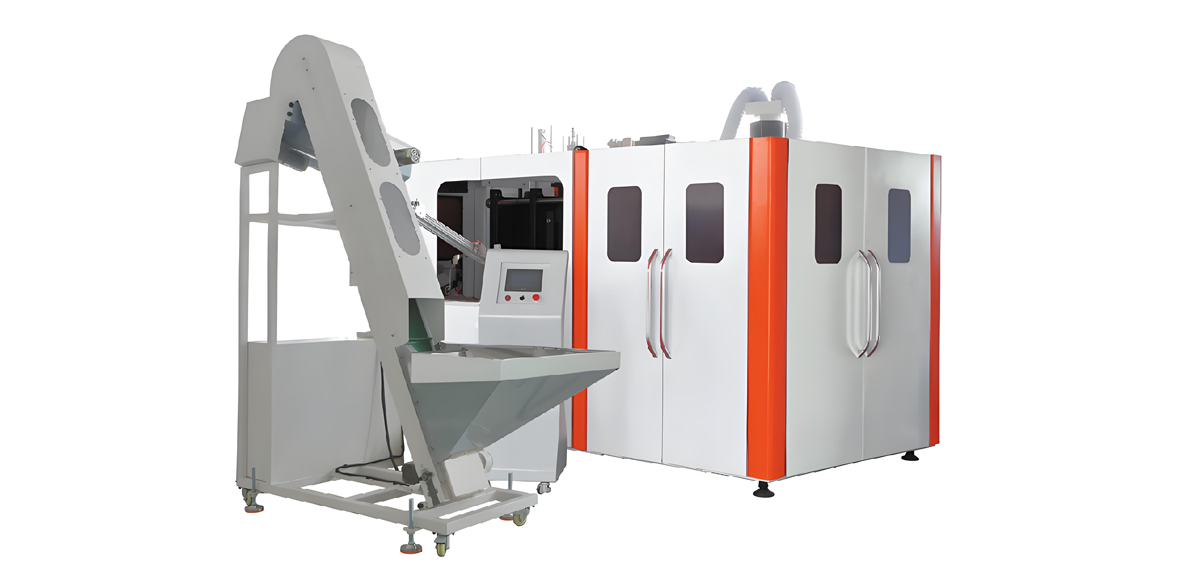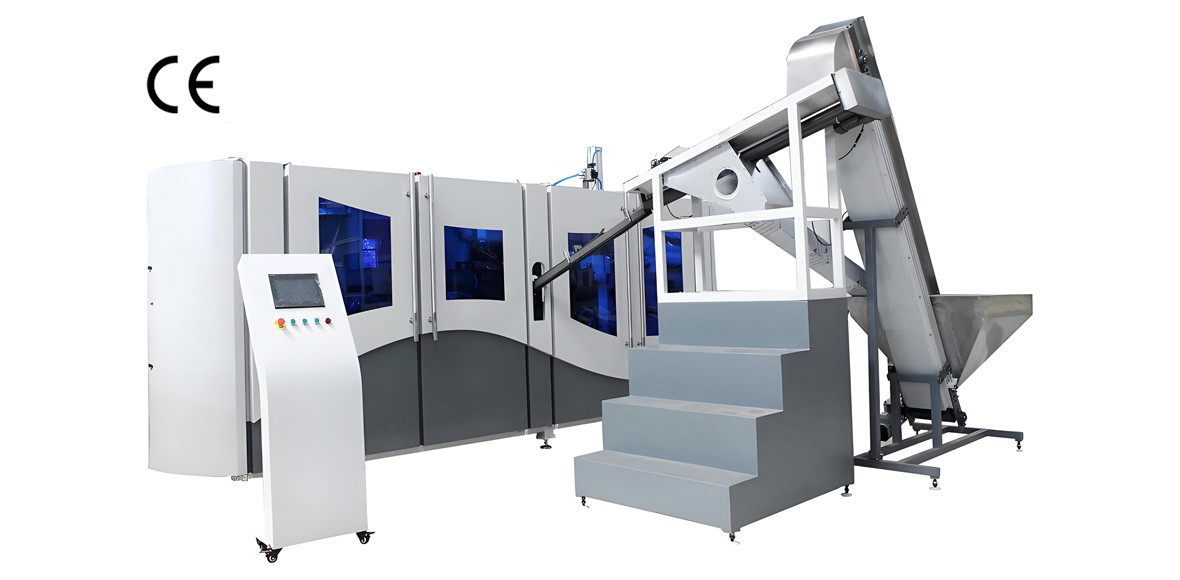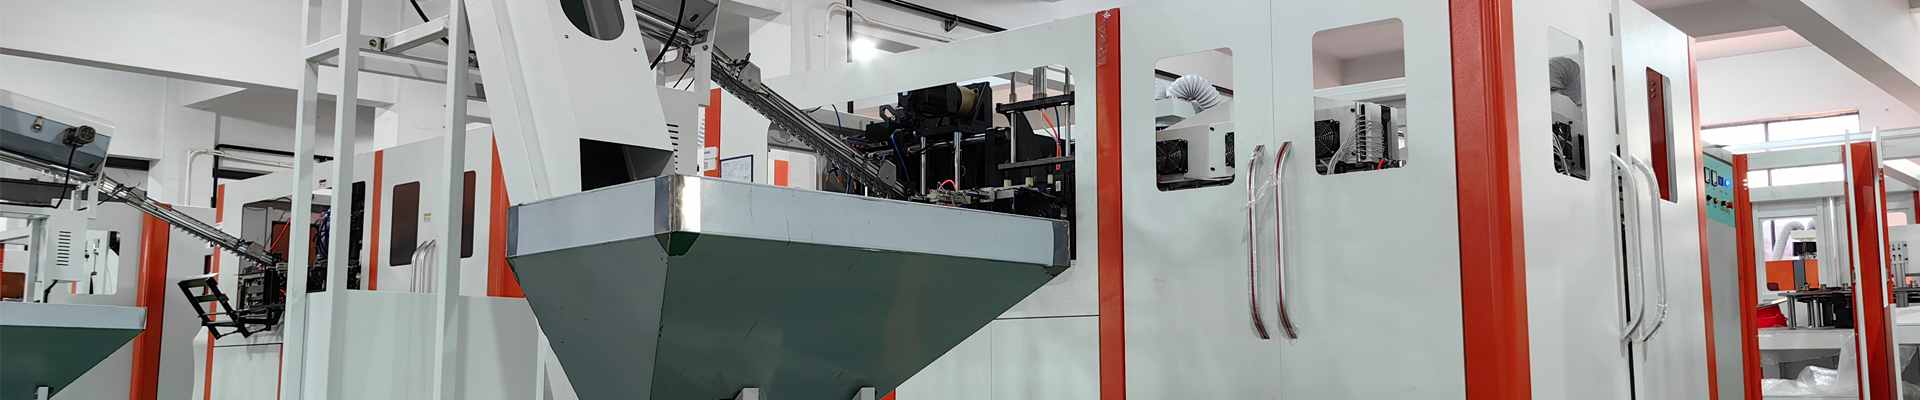
A high-yield PET edible oil bottle production line is one of the most capital-intensive yet strategically important investments a cooking oil, sunflower oil, soybean oil, or olive oil filler can make, because the bottle is both the primary package and the largest recurring conversion cost after the oil itself. For overseas filling plants evaluating capacity expansion, the decision is rarely about whether PET can do the job, but about how quickly a high-yield line returns its capital through lower energy per bottle, fewer operators, higher good-bottle yield, and the barrier performance that keeps edible oil fresh on the shelf. This article presents a structured ROI framework built entirely on non-monetary indicators: output in bottles per hour, overall equipment effectiveness, energy in kilowatt-hours per one thousand bottles, labor in man-hours per one thousand bottles, good-bottle yield in percent, and payback expressed as a relative grade with a month or year range rather than a currency figure. YuDa, a Wanplas factory with more than twenty years in PET bottle blow molding and twenty-plus patents, supplies the FGX high-speed series and the standard full-automatic series referenced throughout, while competitors such as Sidel, Krones, SIPA, AOKI, Nissei ASB, Tech-Long, and Chumpower are used as benchmark references so that buyers can position any quote on a comparable scale.
The central thesis of this ROI analysis is that payback on a PET edible oil line is decided long before the equipment invoice is paid. It is decided in the specification stage, where choices about machine architecture, heater layout, blowing pressure recovery, mold cavitation, and barrier design lock in the energy per bottle, the labor per shift, and the scrap rate that together determine the effective cost per sellable bottle. A line that looks attractive on a headline output number but runs at a low sustained OEE will almost always underperform a properly specified line with a more modest nameplate. The guidance below helps procurement, engineering, and finance teams build a defensible payback model using only relative grades and physical units, which remain valid across every procurement market regardless of local equipment, resin, and utility pricing.
Understanding the ROI Logic of a High-Yield PET Edible Oil Line
The ROI of a high-yield PET edible oil bottle line is the ratio of annual converted value created to the capital and operating resources committed, but because equipment, resin, and energy prices vary sharply by region, the most robust model expresses every input and output in physical and relative terms. Output is measured in bottles per hour and bottles per year at a defined shift pattern. Operating cost is measured in kilowatt-hours per one thousand bottles, man-hours per one thousand bottles, and grams of PET resin per bottle. Quality is measured in good-bottle yield percent. Capital is expressed as a relative investment grade from Low through Medium, High, Very High, to Premium. Payback is then expressed as a month or year range attached to that grade. This approach keeps the analysis honest across markets and prevents a single currency assumption from distorting the comparison between machine families.
For edible oil specifically, the ROI case differs from water or carbonated soft drink lines in three ways that must enter the model early. First, oil bottles require stronger barrier and often UV-tinted PET, which raises gram weight and therefore resin consumption per bottle. Second, oil filling is usually lower speed than water filling, so the line must be specified for the right bottle size mix rather than for a single maximum output. Third, edible oil has a longer shelf life expectation, sometimes twelve to twenty-four months, which makes barrier failure a direct revenue risk rather than a cosmetic one. A ROI model that ignores barrier and shelf life will understate the value of a correctly specified line and may favor a cheaper architecture that later causes oxidation complaints.
Within the Wanplas brand network, YuDa concentrates on PET blow molding while sister factories cover adjacent processes, which matters for total-line ROI. For example, where a filler wants to integrate blowing with filling and capping, the Wanplas main brand supplies linear and rotary blow-fill-cap combi solutions, and YuDa’s blowing module is the bottle-forming core. Treating the blow molder in isolation understates its leverage, because a high-yield, low-energy blow molder improves the economics of the entire filling hall, not just the bottle department.
Why relative grades beat currency in a multi-region ROI model
Procurement teams in different continents face equipment quotes that already include freight, duty, installation, and local service at wildly different levels. Converting everything to a single currency invites error and obscures the physical drivers of payback. By grading investment as Low, Medium, High, Very High, or Premium and pairing each grade with a realistic output level and shift pattern, the buyer can compare a YuDa FGX high-speed line against a European rotary line on the same axis. The relative grade also survives budget revisions, because the physical performance targets, not the price, drive the payback narrative.
Capacity Ramp-Up and OEE as the Payback Foundation
Capacity ramp-up is the single most under-managed phase of a PET edible oil line project, and it is where most payback schedules slip. A line commissioned on Monday does not reach nameplate on Tuesday. Realistic ramp-up moves through three stages: a commissioning and stabilization stage of roughly four to eight weeks where output is intentionally limited to validate heating recipes and blowing curves; a ramp stage of eight to sixteen weeks where output climbs toward design while scrap falls; and a steady stage where the line holds a sustained OEE. Buyers should model payback from the steady stage, then apply a ramp penalty that delays full contribution by one or two quarters depending on operator training and preform quality.
Overall Equipment Effectiveness, or OEE, is the product of availability, performance, and quality, and it is the true denominator of every ROI calculation. Availability captures unplanned stops from mold faults, heater failures, conveyor jams, and changeovers. Performance captures speed loss from reduced blowing rate, slow indexing, or partial cavitation. Quality captures the good-bottle yield after rejecting visual, wall-thickness, and top-load failures. A nameplate of twelve thousand bottles per hour means little if OEE sits at sixty-five percent; the effective output is closer to seventy-eight hundred bottles per hour. The table below shows how OEE translates nameplate into effective annual output under a two-shift, three-hundred-day pattern.
From nameplate to effective output
| Sustained OEE | Nameplate 8,000 BPH | Nameplate 12,000 BPH | Nameplate 15,000 BPH | Effective annual output (300 days, 2 shifts) |
|---|---|---|---|---|
| 65 percent | 5,200 BPH | 7,800 BPH | 9,750 BPH | Low grade, delayed payback |
| 75 percent | 6,000 BPH | 9,000 BPH | 11,250 BPH | Medium grade contribution |
| 80 percent | 6,400 BPH | 9,600 BPH | 12,000 BPH | High grade contribution |
| 85 percent | 6,800 BPH | 10,200 BPH | 12,750 BPH | Very High grade, fastest payback |
The practical implication is that a fifteen-thousand-bottles-per-hour line at sixty-five percent OEE delivers less effective output than a twelve-thousand-bottles-per-hour line at eighty-five percent OEE. When building the ROI model, the buyer should therefore negotiate and contract to an OEE target, not a nameplate. YuDa’s FGX high-speed series, with its cam-linked mold motion and high-speed servo drive, is engineered to hold high performance ratios, while the remote monitoring system lets engineers at the China headquarters read PLC data and catch drifting performance before it becomes a sustained loss, protecting the OEE that underpins payback.
Single-Bottle Energy Consumption as the Largest Operating Lever
Energy is usually the second-largest operating cost on a PET edible oil line after resin, and it is the cost most directly controlled by machine design. Energy per bottle splits into three loads: the preform reheating oven, the high-pressure air compressors, and the auxiliary systems such as conveyors, cooling, and controls. The reheating oven dominates at lower speeds, while compressed air dominates at higher speeds where more cavities blow per minute. Because these are fixed-ish overheads spread across output, energy per bottle falls as OEE rises, which is why a high-yield line, run well, is also a low-energy-per-bottle line.
The heater distance design is a decisive factor. YuDa’s blow molders reduce heater pitch to thirty-eight point one millimeters, which cuts oven electricity by more than thirty percent compared with conventional wider-pitch ovens for the same preform heating profile. For an edible oil filler running two shifts, that single design choice compounds across millions of bottles per year and is one of the cleanest, most defensible lines in the ROI model. The table below compares specific energy across representative configurations, expressed in kilowatt-hours per one thousand bottles at a sustained eighty percent OEE.
Energy per one thousand bottles by configuration
| Line configuration | Oven kWh / 1000 bottles | Air system kWh / 1000 bottles | Auxiliary kWh / 1000 bottles | Total kWh / 1000 bottles | Energy grade |
|---|---|---|---|---|---|
| Semi-auto, wide-pitch oven | 55 to 70 | 40 to 55 | 12 to 18 | 107 to 143 | High |
| Standard full-auto, conventional oven | 38 to 48 | 30 to 42 | 9 to 13 | 77 to 103 | Medium |
| FGX high-speed, 38.1mm oven | 26 to 33 | 26 to 36 | 7 to 10 | 59 to 79 | Low |
| Imported rotary, recovered air | 24 to 30 | 20 to 28 | 6 to 9 | 50 to 67 | Low to Premium |
The spread between the semi-auto wide-pitch configuration and the FGX high-speed configuration is more than forty percent in specific energy, and that gap recurs on every bottle for the life of the machine. In a ROI model expressed in relative grades, moving from a High energy grade to a Low energy grade is typically worth a full payback-grade improvement on its own, because the saved kilowatt-hours per one thousand bottles, multiplied by annual volume, is a permanent annual benefit with no extra capital. Compressed-air recovery, discussed in the companion cost-optimization article, compounds this further by reclaiming blow air for the next cycle.
Labor Configuration and Man-Hour Reduction
Labor is the operating cost most sensitive to automation level, and it is where high-yield lines justify their higher capital grade. A semi-automatic line needs an operator at every station, a preform loader, a bottle unloader, and a quality checker, whereas a fully automatic line collapses those roles into a single line supervisor plus periodic quality sampling. The man-hour per one thousand bottles therefore drops by a factor of three to five when moving from semi-auto to high-speed full-auto, which is a direct, recurring contribution to payback that does not depend on local wage rates to be expressed, only on the physical man-hour ratio.
For edible oil specifically, labor also includes the preform handling and the finished-bottle accumulation before filling, because oil lines often blow bottles in a separate room from the filler. A high-yield line with integrated conveyor logic and automatic deflasher reduces manual bottle handling and the associated contamination risk. The table below shows typical man-hours per one thousand bottles by automation level at a two-shift pattern, assuming one quality sampling round per shift.
Man-hours per one thousand bottles by automation level
| Automation level | Operators per shift | Man-hours / 1000 bottles | Quality sampling load | Labor grade |
|---|---|---|---|---|
| Semi-auto, manual load | 3 to 4 | 0.30 to 0.45 | Manual, continuous | High |
| Standard full-auto | 1 to 2 | 0.10 to 0.18 | Sampled per shift | Medium |
| FGX high-speed, auto load and deflash | 1 | 0.05 to 0.09 | Automated vision assist | Low |
| Combi blow-fill-cap block | 1 shared | 0.04 to 0.07 | Inline, continuous | Low to Premium |
The labor grade interacts with the energy grade because a single supervisor can tend a high-yield line only if the machine is reliable and self-diagnosing. YuDa’s remote monitoring, modular design for fast changeover, and mature component brands all reduce the unplanned-stop component of labor, because the line does not demand constant manual intervention. In the ROI model, the buyer should pair the labor grade with the OEE target: a Low labor grade is only real if availability stays above ninety percent, otherwise the supervisor spends the saved time clearing jams rather than adding value elsewhere.
Yield Rate, Scrap Control, and Resin Loss
Good-bottle yield is the quiet driver of PET edible oil line ROI, because every rejected bottle carries its full resin weight as pure loss plus the energy already spent forming it. Edible oil bottles are heavier than water bottles for the same volume because of barrier and top-load needs, so the resin per scrapped bottle is larger, making scrap control more valuable here than in beverages. A line running at ninety-five percent yield throws away five grams of PET plus forming energy on every one of twenty rejected bottles per four hundred, and at high yield that absolute tonnage is significant across a year.
Scrap on an edible oil line comes from several distinct sources: preform defects carried in from the injection side, heating unevenness causing whitening or crystallinity issues, blowing faults such as incomplete stretch or base fold, and post-blow damage from conveyors or stacking. The first defense is incoming preform specification and incoming inspection; the second is a stable heating recipe; the third is mold condition and blow-air quality. The table below links yield band to recoverable output and relative resin-loss grade at a twelve-thousand-bottles-per-hour nameplate and eighty percent OEE.
Yield band versus recoverable output and resin loss
| Good-bottle yield | Rejected per 1000 | Recoverable bottles per year (300d, 2sh) | Relative resin-loss grade |
|---|---|---|---|
| 95 percent | 50 | Baseline | High |
| 97 percent | 30 | +4.8 million | Medium |
| 99 percent | 10 | +9.6 million | Low |
| 99.5 percent | 5 | +10.8 million | Very Low |
Moving from a ninety-five percent to a ninety-nine percent yield band recovers nearly ten million sellable bottles per year on this reference line, with no added capital, only better process control. That alone can shift payback from a High grade toward a Medium grade. The lesson for the ROI model is to treat yield as a controllable variable with the same weight as energy and labor, and to budget for the inspection and mold-maintenance discipline that sustains it. YuDa’s modular mold design shortens changeover and reduces the handling that causes post-blow damage, supporting a higher sustained yield.
Barrier Properties and Shelf-Life Requirements for Edible Oil
Edible oil is far less forgiving than water when the package fails, because oil oxidizes in the presence of oxygen and light, developing off-flavors and rancidity that destroy brand trust. A PET edible oil bottle must therefore deliver oxygen barrier and light barrier appropriate to the target shelf life, which is typically twelve to twenty-four months in warm markets. The barrier choice is a ROI variable in two directions: too little barrier risks shelf-life failures and recall-grade losses, while too much barrier adds resin and processing cost that may not be needed. The optimum is matched barrier, specified to the real distribution environment rather than to a generic worst case.
Standard PET provides a baseline oxygen barrier acceptable for short shelf life, but most edible oil bottles use thicker side walls, UV-tinted or green-tinted PET to block light, or active and passive barrier enhancements such as oxygen-scavenging layers, coating, or multilayer structures combining PET with a thin barrier resin. Each step raises gram weight and may raise scrap during blowing, so the ROI model must credit the barrier option with the shelf-life extension and complaint reduction it buys, while debiting the extra resin and the slightly higher energy to heat the heavier preform. The table below ranks barrier options by relative protection and by their impact on bottle gram weight and processing difficulty.
Barrier options for PET edible oil bottles
| Barrier approach | Relative oxygen protection | Light protection | Gram-weight impact | Processing difficulty |
|---|---|---|---|---|
| Standard clear PET, thicker wall | Medium | Low | +8 to 15 percent | Low |
| UV-tinted PET | Medium | High | +3 to 8 percent | Low |
| PET with oxygen scavenger | High | Medium | +2 to 5 percent | Medium |
| Coated monolayer PET | Very High | Medium to High | +1 to 3 percent | High |
| Multilayer PET barrier | Very High | High | +4 to 10 percent | Very High |
For most edible oil fillers, UV-tinted PET plus a modest wall-thickness increase captures the bulk of the shelf-life protection at the lowest processing difficulty, which is why it is the default in many markets. The higher-barrier options are justified when distribution includes long, hot transit or when the brand promises an extended shelf life. In the ROI model, the barrier grade should be credited with the reduction in oxidation complaints and the ability to open longer-distance markets, both of which protect revenue and therefore support payback even though they add a little resin. Food-contact compliance with FDA and EU 10/2011 requirements must be documented for any additive or coating used, and YuDa supplies lines compatible with these regulated preform specifications.
Building the Investment Payback Model with Relative Grades
With the physical drivers defined, the payback model assembles them into a single relative grade and a month or year range. The model takes four inputs: the investment grade of the chosen architecture, the output level in bottles per year at target OEE, the operating grade combining energy and labor, and the quality grade from yield and barrier. Each input is scored, then combined into an overall payback grade. The advantage of this method is that it needs no currency: the buyer fills in local prices later, while the physical and relative structure already shows which configuration wins.
A representative scenario set is shown below. The output level assumes a two-shift, three-hundred-day operation at the stated OEE. The payback range is expressed in months and reflects the contribution from energy, labor, and yield improvements relative to a baseline semi-auto line; it intentionally avoids any currency amount. A Premium-grade imported rotary line may deliver the fastest physical payback but carries a Very High investment grade, while a YuDa FGX high-speed line typically lands in the High-to-Very-High payback grade with a Medium-to-High investment grade, which is the strongest combination for many mid-scale edible oil fillers.
Payback scenario matrix
| Scenario | Investment grade | Output level (BPH at OEE) | Operating grade | Payback period range | Payback grade |
|---|---|---|---|---|---|
| Semi-auto baseline | Low | 2,000 to 3,000 | High | 36 to 60 months | High |
| Standard full-auto | Medium | 6,000 to 9,000 | Medium | 24 to 40 months | Medium |
| YuDa FGX high-speed | Medium to High | 10,000 to 14,000 | Low | 18 to 30 months | Very High |
| Imported rotary, recovered air | Very High to Premium | 14,000 to 20,000 | Low to Premium | 15 to 28 months | Very High to Premium |
The matrix makes the trade-off explicit: the semi-auto baseline has the lowest investment grade but the worst payback grade, because its High operating grade and low output cannot generate enough annual contribution. The FGX high-speed line sits in the sweet spot for many edible oil fillers, pairing a Medium-to-High investment grade with a Very High payback grade. The imported rotary line can reach a Premium payback grade but only justifies its Very High to Premium investment grade at very high and sustained volume. The buyer should select the highest payback grade whose investment grade fits the approved capital envelope, then protect that grade by contracting to an OEE target and a yield band rather than a nameplate.
Comparing Machine Architectures for Edible Oil PET Lines
The final step in the ROI analysis is to place candidate machines on one comparable grid. Beyond YuDa, the edible oil and beverage markets reference several established PET blow molder families: Sidel and Krones from Europe, SIPA from Italy, AOKI and Nissei ASB from Japan, and Tech-Long and Chumpower from the broader Asian supply base. Each brings a different balance of investment grade, energy grade, and service footprint. The comparison below is intentionally non-monetary so that a buyer in any region can map a received quote onto the same axes.
Architecture comparison grid
| Machine family | Investment grade | Energy grade | Typical speed range | Service footprint |
|---|---|---|---|---|
| YuDa FGX high-speed | Medium to High | Low | 8,000 to 15,000 BPH | Global, 60+ countries |
| YuDa standard full-auto | Medium | Medium | 1,000 to 7,000 BPH | Global, 60+ countries |
| European rotary (Sidel, Krones) | Very High to Premium | Low to Premium | 14,000 to 24,000 BPH | Strong regional |
| Japanese ISBM (AOKI, Nissei ASB) | High to Premium | Medium to Low | Low to medium BPH | Specialist |
| Asian linear (Tech-Long, Chumpower) | Medium to High | Medium | 6,000 to 14,000 BPH | Regional |
The grid shows why YuDa’s FGX high-speed series is a frequent recommendation for edible oil fillers scaling past the semi-auto stage: it reaches the Low energy grade and a Very High payback grade at a Medium-to-High investment grade, avoiding the Premium capital of a European rotary while still delivering the output and OEE that edible oil economics reward. For very large, single-SKU edible oil plants, a European rotary may win on the Premium payback grade, but only where volume is high and sustained. The Wanplas brand, as the parent of YuDa, also lets a filler source adjacent equipment, blow-fill-cap blocks, and shared service promises from one network, which reduces integration risk and supports the OEE that underpins every payback grade above.
Frequently Asked Questions
What OEE level should a high-yield PET edible oil line target?
A well-commissioned high-yield PET edible oil line should target a sustained OEE between eighty percent and eighty-five percent after the ramp-up quarter, with availability above ninety percent, performance above ninety-five percent, and quality above ninety-eight percent. Below seventy-five percent, the payback grade degrades by at least one full step regardless of how low the equipment price was.
How is payback expressed without a fixed equipment price?
Payback is expressed as a relative investment grade, an output level, and a payback period range in months under a defined shift pattern. This keeps the model comparable across regions where equipment, resin, and utility costs differ, and it lets the buyer insert local pricing only at the final step without rebuilding the analysis.
Why does edible oil need stronger barrier than water?
Edible oil oxidizes when exposed to oxygen and light, producing rancidity. PET edible oil bottles therefore need oxygen and light barrier beyond standard water bottles, achieved through thicker side walls, UV-tinted PET, oxygen scavengers, or coated and multilayer structures. The barrier grade should be matched to the real distribution environment rather than a generic worst case.
Does a high-yield line always mean higher energy per bottle?
No. High-yield lines usually reduce energy per bottle because fixed overhead loads such as ovens, compressors, and controls are spread over more bottles. The lowest specific energy is reached when the line runs near its design OEE rather than at partial load, which is why sustained OEE and energy grade move together in the ROI model.
Which YuDa machine family fits edible oil high-yield lines?
The FGX high-speed series and the standard full-automatic series from YuDa, a Wanplas factory, both serve edible oil PET bottles, with the FGX series preferred where single-mode speed and lowest energy per bottle are decisive. The thirty-eight point one millimeter heater pitch and cam-linked servo motion are the two features most responsible for the Low energy grade.
How much can yield improvement shorten payback?
Moving from a ninety-five percent to a ninety-nine percent good-bottle rate on a high-yield line typically recovers several percent of total bottle output as sellable product, which can shift the payback grade from High toward Medium without any extra capital. Yield is therefore treated as a first-class ROI variable alongside energy and labor.
Conclusion
The ROI of a high-yield PET edible oil bottle production line is decided by physical and relative factors that any filling plant can measure: sustained OEE, energy in kilowatt-hours per one thousand bottles, labor in man-hours per one thousand bottles, good-bottle yield, and the barrier grade needed for shelf life. Expressed this way, the analysis stays valid across every market and every equipment quote, and it points clearly to the configuration that wins. For most edible oil fillers scaling beyond the semi-auto stage, a YuDa FGX high-speed line delivers a Low energy grade, a Low labor grade, and a Very High payback grade at a Medium-to-High investment grade, a combination that is hard to beat without moving to a Premium-cost imported rotary. The discipline that protects this result is to contract to an OEE target and a yield band rather than a nameplate, and to specify barrier matched to the true distribution environment. As a Wanplas factory with more than twenty years of PET blow molding experience, twenty-plus patents, and exports to sixty-plus countries, YuDa provides both the machine families and the remote-monitoring support needed to hold those targets after commissioning, which is where payback is actually earned.