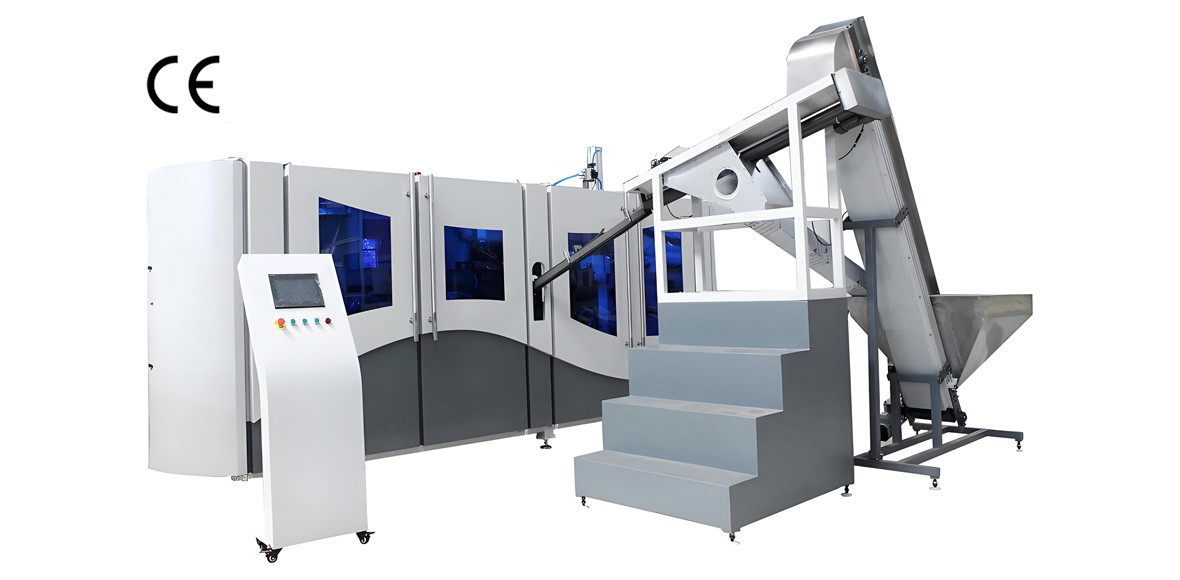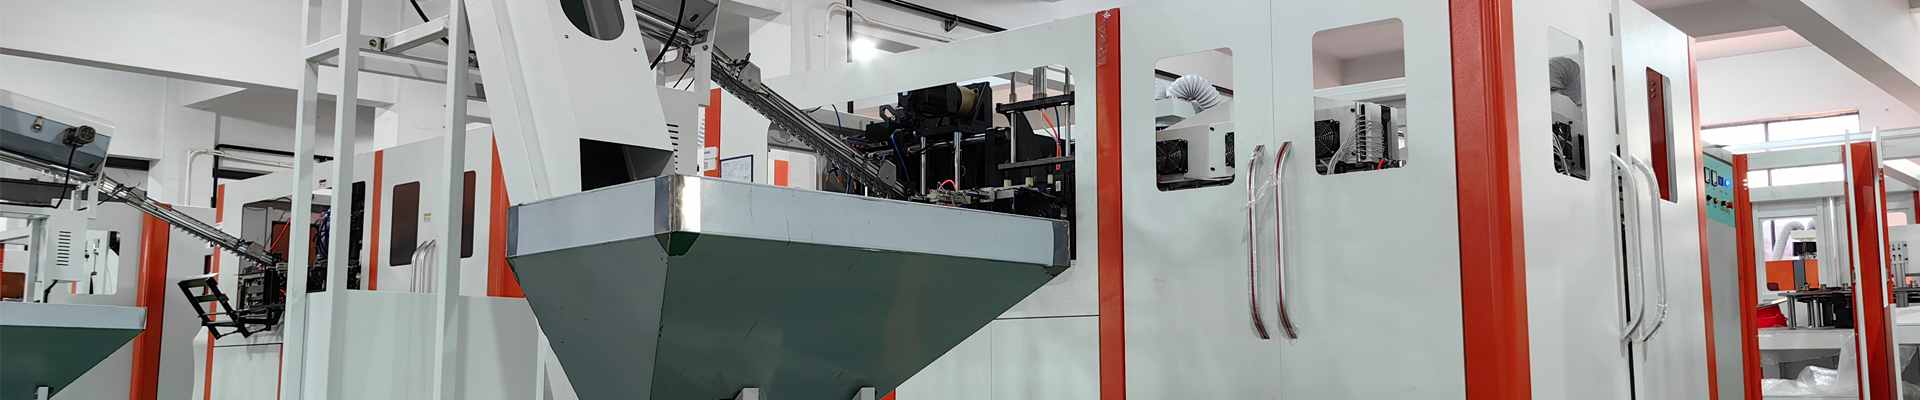
PET bottle production looks deceptively simple: resin goes in one end, finished bottles come out the other. Between those two points, however, a measurable share of bottle-grade PET never reaches the customer as saleable product. This article analyzes raw material waste across the entire PET bottle blowing process — from resin drying and preform handling through heating, stretch blow molding, lightweighting, changeover, and finished-bottle handling — and shows how to quantify every loss in physical units rather than in money. YuDa, a Wanplas factory, has specialized in PET bottle blow molding machines for more than 20 years, exports to over 60 countries, ranks among the top two PET bottle blow machine manufacturers in China, and holds more than 20 patents. The purpose of this guide is to give production engineers and plant managers a practical framework for locating waste, measuring it in grams per bottle and percentages, and eliminating it through process and equipment optimization. You will learn where the largest losses hide, how to build a material-yield baseline, how wall thickness distribution and heating control drive bottle weight, and which machine features physically reduce material consumption.
The Full-Process Material Waste Map — From PET Resin to Finished Bottle
The first step in any loss-reduction program is to draw a complete map of where material leaves the value stream. A bottle-grade PET molecule can exit the process as scrap, as an over-weight finished bottle, as start-up reject, or as a damaged finished bottle. Each exit point has a different root cause and a different lever. The table below lays out the ten most common waste points in a typical two-step PET bottle line that purchases preforms, with typical loss-rate ranges expressed as a share of material input and the realistic optimization headroom available without changing the bottle’s functional specification.
| Process Stage | Loss Type | Typical Loss Rate | Optimization Headroom |
|---|---|---|---|
| 1. Resin drying | IV drop from hydrolysis; off-spec preform discarded | 0.2% – 0.8% | Medium — closed-loop dew point control |
| 2. Preform injection (if in-house) | Runner scrap, start-up rejects, weight deviation | 2.0% – 5.0% | High — hotspot-free mold, gravimetric dosing |
| 3. Preform storage | Moisture regain, dust, impact, crystallization white-up | 0.3% – 1.0% | Medium — sealed, conditioned warehouse |
| 4. Heating (infrared oven) | Uneven temperature -> uneven wall -> over-weight safety margin | 3.0% – 8.0% | Very High — lamp zoning + closed-loop IR |
| 5. Stretch blow molding | Pre-blow timing, rod speed, blow delay, mold temperature | 1.5% – 4.0% | High — servo stretch, recipe control |
| 6. Lightweighting gap | Design redundancy above functional minimum | 8.0% – 27.0% | Premium — redesign with FEA support |
| 7. Changeover / material switch | Tuning rejects, line purge | 0.5% – 2.0% | Medium — quick-change mold, recipe library |
| 8. Start-up / shut-down | Cold-start reject batch | 0.4% – 1.5% | Medium — hot standby, ramp recipe |
| 9. Quality rejects | Wall variation, white-up, base star crack, leak | 1.0% – 3.5% | High — SPC on weight and top-load |
| 10. Secondary loss | Drop, stack, convey scratch, filling-line mismatch | 0.5% – 2.0% | Medium — handling and interface design |
Two observations jump out of this map. First, the heating stage and the lightweighting gap together usually account for more recoverable material than all other stages combined. Second, most losses are not random — they are the predictable result of settings chosen to protect the line against an unknown. When the process is made visible and controllable, the safety margin can be removed and converted into a lighter, still-compliant bottle. The remainder of this article builds the measurement language and the engineering levers to do exactly that.
How to Quantify Raw Material Waste
Waste that is not measured cannot be managed. In a material-loss program the only honest unit is the gram. Money figures change with resin price and exchange rate, but a gram of PET lost per bottle is a gram lost on every shift, in every market, at every price. This section establishes a consistent set of physical metrics and an index method that lets a plant compare its performance before and after improvement without reference to any currency.
Design Weight Versus Measured Weight
Every bottle has a design weight — the target gram weight agreed with the brand owner — and a measured weight, the actual average across a sampled run. The difference is the over-weight, almost always positive, and it is pure waste. A line running a 500 mL water bottle at a 13.0 g design but measuring 13.6 g average is losing 0.6 g per bottle to process scatter and conservative setting. Spread that across millions of bottles and the annual loss becomes visible in tons.
Material Yield
Material yield is the ratio of finished, saleable bottle weight to total PET resin input over the same period:
Material yield percent = (total finished bottle weight) divided by (total resin input weight) times 100.
For a plant that buys preforms, resin input equals preform weight purchased (minus preforms returned as scrap). For a plant that makes preforms in-house, resin input includes drying and injection losses. A well-run two-step line buying preforms typically shows a yield of 94 percent to 97 percent; an integrated preform-and-blow plant typically shows 90 percent to 95 percent because it also carries injection and drying losses. Yield below 90 percent signals a major, addressable problem.
Kilograms per Ten Thousand Bottles and Annualized Tons
The most operationally useful number on a shop floor is loss in kilograms per ten thousand bottles. The formula is simple:
Loss (kg per 10,000 bottles) = average over-weight (g/bottle) times 10,000 divided by 1,000,000.
An over-weight of 0.6 g per bottle equals 6 kg of PET per ten thousand bottles. At a line producing 50 million bottles per year, that single over-weight stream becomes 30,000 kg, or 30 tons, of PET per year converted to scrap or to an unnecessarily heavy bottle. Expressing waste this way makes the target concrete: cutting over-weight from 0.6 g to 0.2 g removes 20 tons per year from the same line.
SPC Control Charts and Cpk
Weight variation, not just average weight, drives scrap. A bottle that averages correctly but varies plus or minus 1.2 g forces the operator to raise the set point to keep the light tail above the legal and functional minimum, which shifts the whole distribution upward. Statistical process control with a control chart on bottle weight, sampled every two hours, plus a capability index (Cpk) above 1.33 on the lower specification limit, is the standard that keeps the distribution tight and the set point low. Tightening Cpk from 1.0 to 1.5 typically allows a 2 percent to 5 percent reduction in set-point weight.
OEE Decomposition
Overall equipment effectiveness connects material loss to uptime and speed. OEE equals availability times performance times quality. In bottle blowing the quality term is where material waste lives: every rejected bottle is resin that entered the machine and left as scrap. A line at 92 percent availability, 95 percent performance, and 98 percent quality runs at 85.6 percent OEE; lifting quality from 98 percent to 99.3 percent while holding the others steady raises OEE to 86.7 percent and removes roughly 1.3 percent of throughput from the scrap stream. The table below shows how the three OEE terms map to material outcomes.
| OEE Term | What It Captures | Typical Range | Material Link |
|---|---|---|---|
| Availability | Downtime, changeover, faults | 88% – 94% | Fewer cold starts, less batch scrap |
| Performance | Speed loss vs rated BPH | 92% – 97% | Stable cycle reduces tuning rejects |
| Quality | Scrap and rework rate | 97% – 99.5% | Directly equals material yield loss |
The 100 Index-Point Baseline
To compare improvement measures on one scale, set the pre-optimization single-bottle material consumption at 100 index points. Every improvement then moves the index downward. The table below shows how representative measures shift the index, using a baseline of 100 and assuming each measure is applied on top of the previous one.
| Improvement Measure | Index Change (points) | Resulting Index |
|---|---|---|
| Baseline (pre-optimization) | 0 | 100 |
| Heating optimization (lamp zoning + closed-loop IR) | −8 to −12 | 88 – 92 |
| Pre-blow curve control | −4 to −6 | 84 – 86 |
| Tighter weight SPC (raise Cpk) | −3 to −5 | 80 – 82 |
| Reduced start-up and changeover scrap | −2 to −3 | 78 – 79 |
| Lightweighting redesign (500 mL water 13 g to 9.5 g) | −25 to −28 | 51 – 54 |
The index makes one point unmistakable: heating control and lightweighting are where the large, durable reductions live. The downstream tuning measures matter, but they are smaller in magnitude. A plant should sequence its program so the high-impact levers come first.
Wall Thickness Distribution and Lightweighting
A PET bottle is not a uniform shell. It is a carefully varied thickness profile engineered so that each zone carries exactly the load it must, and no more. The art of lightweighting is to move material from over-built zones to under-built zones, or to remove it entirely, while keeping top-load strength, pressure resistance, and drop performance inside specification. This is fundamentally a wall-thickness-distribution problem, and it begins with measurement.
Slice-and-Weigh Method
The accepted way to map a bottle wall is the slice-and-weigh method. A sampled bottle is cut into horizontal bands — neck, neck support ring, shoulder, body upper, body middle, body lower, base, and foot — and each band is weighed on an analytical balance. Because PET density is essentially fixed near 1.37 g per cubic centimeter, band weight converts directly to average band thickness. Repeating this across many bottles reveals both the average profile and its variation. A profile that is thick in the shoulder and thin in the lower body is a candidate for redistribution; a profile with high lot-to-lot variation is a signal that the heating or blow timing is drifting.
Target Wall Thickness by Bottle Zone
The table below lists typical target thickness ranges for a standard 500 mL non-carbonated water bottle after lightweighting. These are reference values; the correct numbers for a given bottle come from finite-element analysis and drop testing. They illustrate how uneven a real profile is and why a single “average thickness” number hides waste.
| Bottle Zone | Target Thickness (mm) | Driving Requirement |
|---|---|---|
| Neck and support ring | 2.8 – 4.0 | Thread torque, capping, handling |
| Shoulder | 0.22 – 0.32 | Stretch uniformity, top-load |
| Body upper | 0.20 – 0.28 | Top-load, label grip |
| Body middle | 0.18 – 0.24 | Lightest zone, orientation |
| Body lower | 0.20 – 0.30 | Impact, base transition |
| Base and foot | 0.25 – 0.40 | Pressure, standing, drop |
Stretch Ratio and Molecular Orientation
Stretch blow molding works by biaxial orientation: the preform is stretched in the machine (axial) direction by a stretch rod and in the circumferential (hoop) direction by compressed air. Orientation aligns the PET chains, which is what gives a thin wall its strength. The two stretch ratios and their product, the total area stretch ratio, determine how much strength a given gram of PET delivers. The reference ranges below are the engineering window for a strong, clear bottle.
| Stretch Parameter | Reference Range | Effect on Bottle |
|---|---|---|
| Axial stretch ratio | 2.8 – 3.2 | Top-load and vertical clarity |
| Hoop (circumferential) stretch ratio | 3.5 – 4.5 | Pressure resistance, drop |
| Total area stretch ratio | 10 – 14 | Overall strength per gram |
When the hoop stretch ratio falls below about 3.5, the wall does not orient fully and the bottle needs more material to pass the same pressure test. When the preform is heated unevenly, the stretch ratios cannot be reached uniformly, so engineers add weight to compensate. This is the direct chain from heating quality to bottle weight. A 500 mL water bottle designed at 12 g to 14 g can typically be brought to 9 g to 10 g by combining a better stretch profile with a redesigned preform — a 27 percent to 36 percent reduction in single-bottle material that, in index terms, takes the bottle from 100 points to roughly 64 to 73 points before any other measure is applied.
Heating Optimization — The Largest Waste Source
If one stage deserves the most attention, it is the infrared preform oven. The preform enters the oven as a thick-walled tube and must leave with a precise, uniform temperature profile so that the stretch blow step can orient the material evenly. When the temperature profile is wrong, the bottle wall ends up uneven, the weak zones fail testing, and the only practical fix available on the floor is to raise overall bottle weight. That added weight is invisible waste created entirely by the heater.
Lamp Zone Count and Material Savings
An oven is divided into lamp zones, each independently controllable. A machine with more, finer zones can shape the temperature profile along the preform length instead of applying one average heat. The relationship is direct: more zones mean a closer match between the heated preform and the target wall profile, which means less compensatory weight. YuDa machines minimize the heater pitch to 38.1 mm and use independently controlled zones, which both improves profile control and reduces electricity consumption by more than 30 percent compared with conventional ovens. The table below contrasts oven configurations by their material-saving potential.
| Oven Configuration | Temperature Control | Typical Index Relief |
|---|---|---|
| Coarse, 4–6 wide zones | One average setting | 0 (baseline) |
| Medium, 8–12 zones | Segmented profile | −4 to −7 points |
| Fine, 16+ zones with 38.1 mm pitch | Per-zone closed loop | −8 to −12 points |
Preform Surface Temperature Window
The preform surface temperature at the oven exit is the single number that decides orientation quality. For most bottle-grade PET the useful window is about 95 degrees C to 115 degrees C at the surface, with the exact value depending on preform geometry and bottle shape. Below the window the material is too stiff to orient; above it the preform skins over and the core stays cool, producing a weak, hazy bottle. A closed-loop infrared thermometer that reads each preform and trims lamp power keeps the exit temperature inside the window regardless of ambient drift, lamp aging, or preform color. Preform rotation as it travels through the oven removes the hot and cold sides that a stationary preform would otherwise carry into the mold.
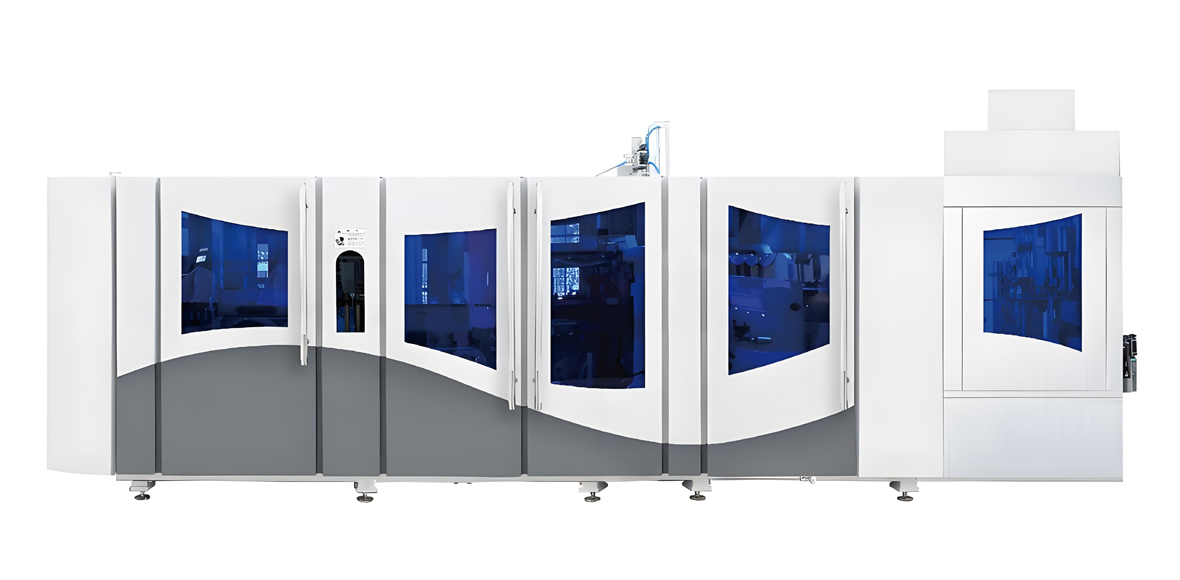
YuDa’s FGX high-speed series applies exactly this philosophy: fine lamp zoning, short 38.1 mm heater pitch, servo-driven oven transport, and a recipe system that stores per-SKU temperature profiles. The result is a machine that holds the temperature window shift after shift, which is the precondition for taking weight out of the bottle without raising the reject rate. The specification table below is representative of the FGX high-speed family.
| FGX High-Speed Series — Parameter | Specification |
|---|---|
| Cavity number | 4 to 12 cavities |
| Theoretical output | 8,000 to 15,000 BPH (single-mold speed 2,500 to 3,000 BPH) |
| Bottle volume range | 0.2 L to 2.0 L (water and CSD) |
| Infrared lamp zones | 16+ independently controlled, 38.1 mm pitch |
| Blow pressure (high-pressure blow) | 30 to 40 bar |
| Installed power | 48 kW to 96 kW by cavity count |
| Compressed air consumption | 1.8 to 3.2 Nm3 per 1,000 bottles by bottle weight |
| Material-saving features | Pre-blow curve control, servo stretch rod, closed-loop IR, recipe library |
Stretch Blow Molding Process Control
Once the preform leaves the oven at the correct temperature, the stretch blow step converts that thermal energy into a thin, oriented wall — or wastes it. Three variables dominate: the pre-blow event, the stretch rod motion, and the high-pressure blow timing. Getting them right is the difference between a bottle that meets spec at 9.5 g and one that needs 11.5 g to survive the line.
Pre-blow Curve Control
The pre-blow is a low-pressure air pulse, typically 8 bar to 15 bar, applied just after the stretch rod begins to extend. Its job is to start the preform ballooning into the mold before the high-pressure blow locks the shape. If pre-blow comes too early, material piles up at the base; too late, and the shoulder and body thin out unevenly. A machine that lets the operator program the pre-blow pressure and the precise start delay against rod position — rather than a single fixed pulse — can tune the wall into the target profile zone by zone. On the index scale this control alone returns roughly 4 to 6 points.
Stretch Rod Synchronization
The stretch rod must reach its end position in lockstep with the pre-blow and the mold-close sequence. A servo-driven rod gives repeatable, recipe-stored speed and final position; a pneumatic rod drifts with air temperature and wear. Synchronization matters because the axial stretch ratio (the 2.8 to 3.2 window) is set by rod travel relative to preform length. When rod travel varies, axial orientation varies, and the light tail of the distribution fails top-load, which forces a weight increase. Servo stretch is therefore not a speed feature alone; it is a material feature.
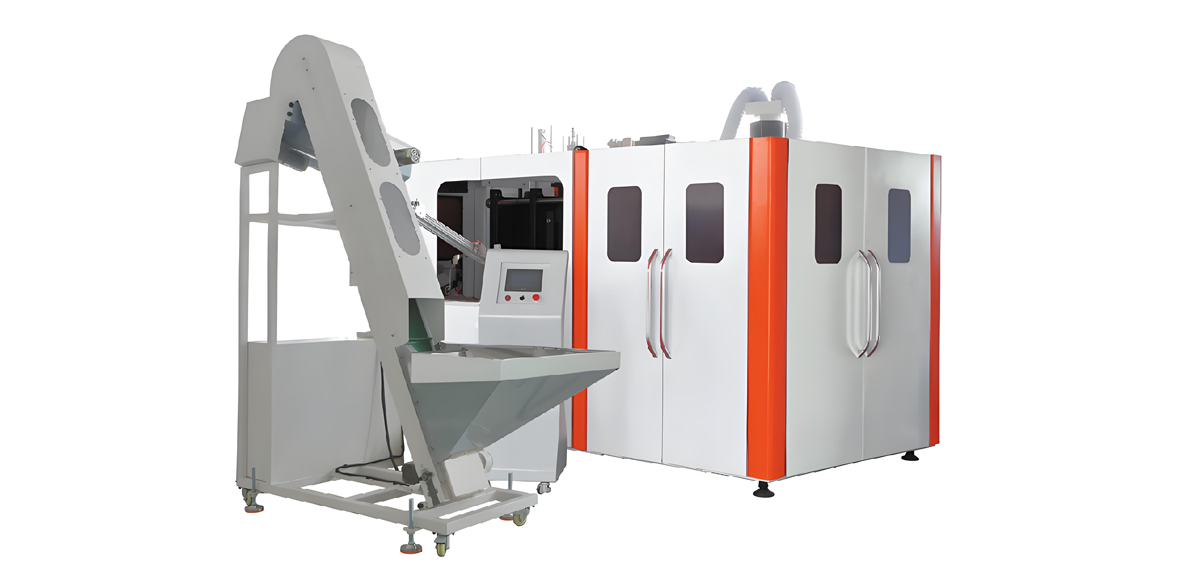
YuDa’s standard-speed series covers the 1,000 BPH to 7,000 BPH band and brings the same servo and recipe discipline to plants that do not need the highest output. The specification below is representative of that family.
| Standard-Speed Series — Parameter | Specification |
|---|---|
| Cavity number | 2 to 8 cavities |
| Theoretical output | 1,000 to 7,000 BPH |
| Bottle volume range | 0.1 L to 3.0 L (water, CSD, oil, daily chemical) |
| Infrared lamp count / power | 8 to 16 zones, 2,000 W to 3,000 W per lamp |
| Blow pressure (high-pressure blow) | 28 to 40 bar |
| Installed power | 24 kW to 72 kW by cavity count |
| Compressed air consumption | 2.0 to 3.6 Nm3 per 1,000 bottles by bottle weight |
| Material-saving features | Programmable pre-blow curve, servo stretch, mold-temp control |
Recycled Material and rPET Blending
Recycled PET, whether from in-house blow scrap or from post-consumer flake, is the other lever on net raw material consumption. Using it does not lighten the individual bottle, but it reduces the virgin resin drawn from the supply chain for the same output. The constraint is quality: every recycle pass lowers intrinsic viscosity (IV) and can raise acetaldehyde (AA), and food-contact rules cap what may be used.
In-house blow scrap is the cleanest stream. Rejected bottles and trimmings are crushed, washed, and re-extruded into preforms or blended back at a controlled rate. Post-consumer rPET must meet food-contact standards; relevant references are FDA rules in the United States and EU 10/2011 in Europe, cited here as plain text only. Supervised rPET use at a 10 percent to 30 percent blend typically keeps IV within the bottle-grade window of 0.76 to 0.84 dL/g after compensation, while AA must be held below the sensory threshold for water and beverage bottles. The table below summarizes how blend level affects the two key properties.
| rPET Blend Level | IV Impact | AA Impact | Use Note |
|---|---|---|---|
| In-house scrap, 5% – 15% | Negligible | Low | Standard practice, closed loop |
| rPET, 10% – 30% | Small drop, compensate | Monitor | Food contact only if compliant |
| rPET, above 50% | Clear IV loss | Higher risk | Usually non-food or with solid-state polycondensation |
A practical rule: run in-house scrap back into the loop at every opportunity because it is clean and free of contamination risk, and treat post-consumer rPET as a separately qualified stream with its own incoming IV and AA test. Done this way, recycled content cuts net virgin consumption by single-digit to low-double-digit percentages without touching bottle weight or strength.
Improvement Priority Matrix and 12-Month Roadmap
With the loss map, the metrics, and the machine levers in hand, the next task is sequencing. Not every measure is equal, and not every measure is cheap to implement. The priority matrix ranks measures by implementation difficulty, material-saving magnitude, and time to result, so a plant can plan a program that delivers visible gram-per-bottle reduction inside the first quarter.
| Measure | Difficulty | Material Saving | Lead Time |
|---|---|---|---|
| Heating optimization (lamp zoning + IR loop) | Medium | 8% – 12% | 4 – 8 weeks |
| Pre-blow curve and servo stretch tuning | Low | 4% – 6% | 2 – 4 weeks |
| Weight SPC and Cpk tightening | Low | 2% – 5% | 2 – 6 weeks |
| Start-up and changeover scrap reduction | Low | 1% – 3% | 3 – 6 weeks |
| Lightweighting redesign (preform + wall) | High | 25% – 36% | 3 – 9 months |
| rPET / in-house scrap loop | Medium | 5% – 15% (virgin) | 6 – 12 weeks |
The roadmap below spreads these measures across a year so that early, low-difficulty wins fund the heavier redesign work later. It assumes a plant starting from the 100 index baseline with a 500 mL water bottle at roughly 13 g.
| Month | Action | Index Target |
|---|---|---|
| 1 – 2 | Baseline measurement, SPC chart, pre-blow tuning | 100 to 93 |
| 3 – 4 | Heating optimization, scrap loop start | 93 to 84 |
| 5 – 6 | Changeover and start-up discipline, Cpk lift | 84 to 80 |
| 7 – 9 | Lightweighting redesign, FEA, drop test | 80 to 64 |
| 10 – 12 | rPET qualification, stabilized control, audit | 64 to 58 |
A plant that follows this sequence can reasonably expect to move from 100 index points to the high-50s within a year, a roughly 40 percent reduction in single-bottle material consumption, while holding every functional and regulatory requirement. The early months deliver the quick, visible wins; the later months deliver the structural reduction that compounding interest makes most valuable.
Shift-Level Management and SOP
Equipment and recipes create the ceiling for material efficiency; people and discipline determine whether the plant lives under that ceiling every shift. The measures in this section cost almost nothing to implement and protect the gains earned by the engineering work above.
First-Article Confirmation
At the start of every run, and after every changeover, the operator weighs and inspects the first acceptable bottle before the run is released to the line. This single checkpoint catches a wrongly loaded recipe, a mis-seated preform, or a cold oven before thousands of bottles are made. It is the cheapest gram-per-bottle insurance on the floor.
Two-Hour Weight Sampling
A sample of at least five bottles is weighed every two hours and plotted on the SPC chart. The control limits are set from a stable baseline, not from the design weight alone, so the chart shows drift in real time. When the average creeps up or the spread widens, the cause — usually a lamp aging, a cooling-air change, or a preform lot change — is found while the loss is still small.
Scrap Classification Ledger
Every rejected bottle is sorted by defect type, not just counted. A ledger that records wall variation, white-up (stress whitening), pearl luster, neck deformation, base star crack, body collapse, and seal failure turns a single scrap percent into a diagnostic tool. The table below shows how defect type points to root cause and to the lever that removes it.
| Defect Class | Likely Root Cause | Primary Lever |
|---|---|---|
| Wall variation (uneven) | Oven temperature profile | Lamp zoning, IR loop |
| White-up (stress whitening) | Over-stretch, cold preform | Temperature window, rod speed |
| Base star crack | Base over-thin, blow timing | Pre-blow curve, base thickness |
| Neck deformation | Cooling, transfer | Mold temperature, transfer timing |
| Seal failure | Finish cooling, capping interface | Finish cooling, cap match |
Operator SOP
A one-page standard operating procedure for each bottle type fixes the recipe, the sampling rule, the first-article step, and the escalation path when control limits are breached. Written SOPs convert tribal knowledge into repeatable practice and keep a night shift as efficient as a day shift.
YuDa Product Range for Material-Efficient Blowing
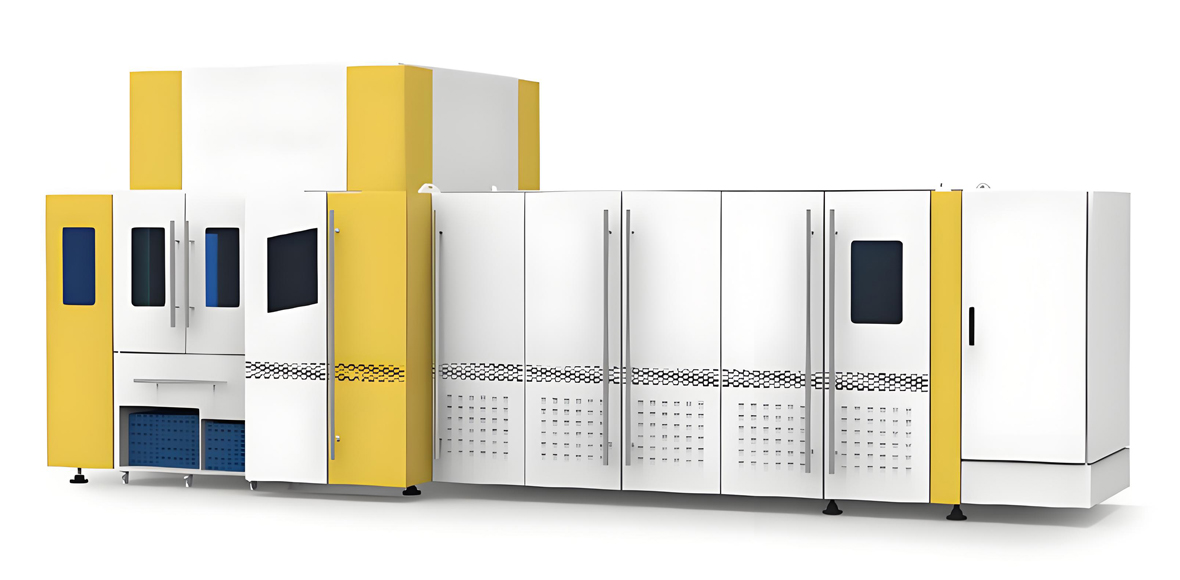
The right machine is the foundation of low material consumption. YuDa, a Wanplas factory, designs its PET bottle blow molding machines around the levers this article describes: fine lamp zoning, a short 38.1 mm heater pitch, servo stretch control, programmable pre-blow, and recipe management that stores a validated profile for every SKU. The three families below cover the full output band from pilot lines to high-volume plants.
| Linear BFC CombiBlock — Parameter | Specification |
|---|---|
| Cavity number | 2 to 6 cavities |
| Theoretical output | 1,500 to 6,000 BPH (blow + fill + cap) |
| Bottle volume range | 0.2 L to 2.0 L drinking water |
| Infrared lamp zones | 8 to 12 zones, 38.1 mm pitch |
| Blow pressure (high-pressure blow) | 30 to 40 bar |
| Installed power | 36 kW to 80 kW |
| Footprint advantage | Integrated block saves plant area |
| Material-saving features | Single recipe from blow to cap, minimal transfer loss |
The selection table below maps a typical requirement to the YuDa family that fits. It is a starting point; the correct model for a specific bottle and output is confirmed by a sample trial and a factory audit.
| Bottle Volume | Required Output (BPH) | Material / Note | Recommended YuDa Model |
|---|---|---|---|
| 0.2 L – 0.6 L water | 8,000 – 15,000 | Lightweight CSD/water | FGX high-speed series |
| 0.5 L – 2.0 L water | 3,000 – 7,000 | Standard volume | Standard-speed series |
| 1.0 L – 3.0 L oil / daily chemical | 1,000 – 4,000 | Heavier section, non-CSD | Standard-speed series, larger cavity |
| 0.2 L – 2.0 L water, integrated | 1,500 – 6,000 | Blow + fill + cap | Linear BFC CombiBlock |
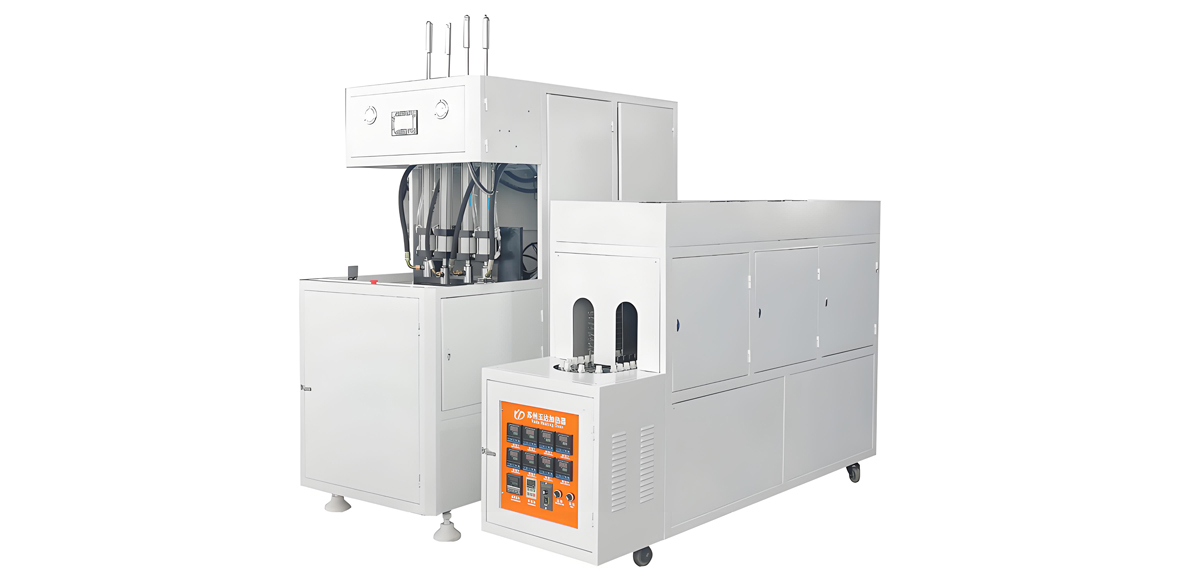
| Pilot / small batch | 300 – 1,500 | Flexible, low volume | Semi-auto series |
Application Industries
The waste-control methods above apply across every PET bottle segment, but the functional floor — and therefore the lightweighting headroom — differs by product. YuDa machines serve the following end products, each with its own constraint:
- Mineral water bottles — the lightest functional specification, where 500 mL can reach 9 g to 10 g; the largest lightweighting headroom.
- Carbonated beverage bottles — pressure resistance sets a higher wall and base thickness floor; stretch ratio and base design dominate.
- Edible oil bottles — larger volume and barrier needs; oxygen and light barrier drive wall and sometimes a colored or opaque preform.
- Daily chemical bottles — detergents and personal care; chemical resistance and squeeze recovery set the profile.
- Hot-fill and heat-set bottles — a heat-set process with a third blowing stage gives thermal stability for filled product above 80 degrees C; the extra orientation step changes the wall strategy.
For each segment the same discipline holds: measure the wall, hold the temperature window, control the pre-blow, and sample weight every two hours. The segment only changes where the floor sits.
Service and Support
Material efficiency is sustained over the machine’s life, not achieved once at commissioning. YuDa, as a Wanplas factory, supports the full life cycle so that the gram-per-bottle gains earned in the first month survive for years:
- Pre-shipment testing — each line runs a production trial on the customer’s bottle and preform before delivery, with weight and reject rate recorded as acceptance criteria.
- Installation and commissioning — engineers set the recipe, confirm the temperature window, and train the team to read the SPC chart on site.
- Spare parts policy — USD 500 free parts every year under the Wanplas group policy, with warranty replacement for damaged parts.
- Training — operator and maintenance courses covering oven zoning, pre-blow tuning, weight sampling, and scrap classification.
- Remote operation and maintenance — the monitoring system lets engineers at the China headquarters read PLC data and give abnormal feedback to the client site, shortening the loop between a drift and a fix.
- Open-factory visits — the plant welcomes customer audits, sample trials, and joint lightweighting workshops on real bottles.
Frequently Asked Questions
How is PET raw material waste quantified on a blowing line?
The honest unit is the gram. Plants track design weight versus measured weight, compute material yield as finished bottle weight divided by resin input, express loss as kilograms per ten thousand bottles, and plot bottle weight on an SPC chart with a Cpk above 1.33 on the lower limit. All of these are physical measures that stay valid at any resin price.
What is the single largest source of material waste in PET bottle blowing?
The infrared preform oven is usually the largest source. Uneven heating forces a thicker, heavier bottle to protect against weak zones, and that compensatory weight is pure waste. Fine lamp zoning with a short 38.1 mm pitch and a closed-loop infrared thermometer typically returns 8 percent to 12 percent on the material index.
How much bottle weight can be removed through lightweighting without losing strength?
For a 500 mL water bottle, moving from a 12 g to 14 g design to a 9 g to 10 g design is a realistic, well-documented path when paired with a redesigned preform and confirmed stretch ratios of 2.8 to 3.2 axial and 3.5 to 4.5 hoop. That is a 27 percent to 36 percent reduction in single-bottle material while holding top-load and drop performance.
Why does the infrared preform oven matter so much for material consumption?
The oven sets the temperature profile that the stretch blow step must work with. If the preform leaves too cold, too hot, or uneven, the wall cannot orient uniformly, so engineers add weight to pass tests. Controlling the 95 degrees C to 115 degrees C surface window per zone removes that need and lets the bottle be thinner.
How does pre-blow timing affect wall thickness and scrap?
The pre-blow is a low-pressure pulse, typically 8 bar to 15 bar, that starts the preform expanding before the high-pressure blow. Correct timing and pressure shape the wall into the target profile; wrong timing piles material at the base or starves the shoulder, raising scrap and forcing weight upward. Programmable pre-blow curves return about 4 percent to 6 percent on the index.
Can recycled PET be blended into bottle production, and how does it affect waste?
Yes. In-house blow scrap should be looped back at 5 percent to 15 percent as standard practice. Post-consumer rPET can be used at 10 percent to 30 percent when it meets food-contact references such as FDA in the United States and EU 10/2011 in Europe, with IV held in the 0.76 to 0.84 dL/g window and acetaldehyde monitored. Blending does not lighten the bottle but cuts net virgin consumption.
What OEE level should a well-run blowing line target?
A strong line runs near 85 percent to 88 percent OEE, built from about 90 percent availability, 95 percent performance, and 98 percent to 99.5 percent quality. Because the quality term equals the scrap rate, lifting quality directly removes material from the waste stream without changing the bottle.
How does YuDa support material-efficient commissioning and training?
Each line is trial-run on the customer’s bottle before shipment with weight and reject recorded, commissioned on site with the heating and pre-blow recipe validated, and backed by operator training, remote PLC monitoring from the China headquarters, USD 500 free parts every year, and open-factory audits for joint lightweighting work.
Conclusion
Raw material waste in PET bottle blowing is not a mystery and it is not a matter of resin price. It is a set of identifiable, measurable, and removable losses distributed across drying, preform handling, heating, stretch blow molding, lightweighting, changeover, and finished-bottle handling. By setting the pre-optimization bottle at 100 index points and attacking the heating stage and the lightweighting gap first, a plant can realistically reach the high-50s index within a year — a roughly 40 percent cut in single-bottle material — while keeping every functional and regulatory requirement intact. The grammar of the work is physical: grams per bottle, yield percent, kilograms per ten thousand bottles, Cpk, and OEE. YuDa, a Wanplas factory, builds the machine foundation for that grammar through fine lamp zoning, a 38.1 mm heater pitch, servo stretch, programmable pre-blow, and recipe management, and supports it for the life of the line. If you run a PET bottle line and want to locate your own waste map and build a reduction program on real bottles, contact the YuDa team to arrange a sample trial, a factory audit, and a tailored configuration built around your bottle and output.